I managed to grant permission from the local authorities (Junta de Andalucia) here in my city Almeria to place two low-cost monitors among the reference instruments in order to determine whether the two consumer products could offer fair readings to the users.
After filing some paperwork and the help of the responsible people in my city, they granted me access to the reference Monitor ES1393A (Mediterráneo) that complies with all EU standards. It is a quite powerful station as it is equipped with many expensive instruments (figure 1) which measure many types of pollutants, such as Nitrogen Oxide (NO), Nitrogen Dioxide (NO2), ground-level Ozone (O3), Carbon Monoxide (CO), Sulphur Dioxide (SO2), PM10, PM2.5 and many more.
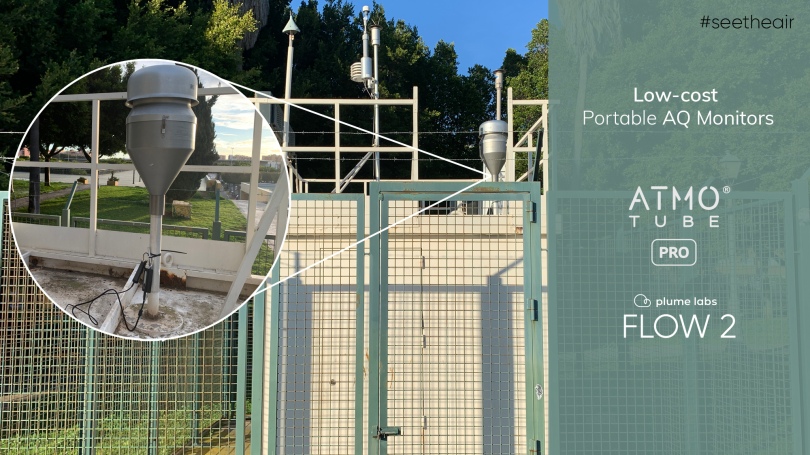
The portable consumer-grade monitors that I placed in the reference AQ station were the Atmotube Pro and the Flow 2. Of course, I placed them outside the station and I attached them to the PM2.5 beta attenuation monitor air inlet (as you can see in figure 2) because I wanted to ensure the greatest PM2.5 correlation possible.
A beta attenuation monitor (BAM) is a universally used air monitoring technique that employs the absorption of beta radiation by solid particles extracted from airflow. This technique allows for the precise detection of PM2.5 without humidity affecting the results (a common problem for the laser scattering sensors). However, there are some drawbacks, for instance, it doesn’t provide data in real-time and it takes only a few measurements in an hour.


The portable monitors took measurements continuously for three and a half days with an interval of 1 minute between each measurement. The reference monitors took measurements every 10 minutes, so the data from the reference monitor are not as dense as from the Atmotube and Flow but are much more accurate and even without the same density we will be able to get a good idea of what is going on.
Before presenting the results from this comparison, I would like to mention that my measurements cannot be taken as a “de facto”. In order to determine the real correlation of a monitor or a sensor, you need at least 3 units and various days to months of data. Maybe some other units from both parties, PlumeLabs and Atmotube, may give different results. The climate also affects the performance of the sensors, so a different geographical location can give us different results.
Nitrogen Dioxide
Let’s begin with the comparison of the NO2 gas sensor inside the Flow 2 and the reference monitor Teledyne Model 200E. The official measurements were in μg/m3 so I had to convert them into parts per billion (ppb). Converting the original values to ppb is not an easy task as you have to know the molecular weight of the pollutants (NO2=46.0055g/mol) and most importantly the temperature and atmospheric pressure at the time each value was taken, the problem was that they didn’t provide me with that data and I didn’t have them either. As a result, I looked them up and the average values were 15°C/59°F and 1019hPa, so to simplify my workflow I used those numbers in the formula for all the conversions. I know, I know, the data from the reference monitor are not 100% correct now but they are very close so they will do the trick.

As you can see in the graph above there are quite many similarities in the trajectory of the lines. I was quite surprised and happy to be honest. You can clearly see how the low-cost sensor keeps getting exited from the pollutant(s) for a longer time but it was able to follow the official measurements. Keep that in mind, the official monitor Teledyne Model 200E worths around 8,000€ and Flow worths 159€.
Particulate Matter
Let’s continue our comparison with the Particulate Matter sensors from Atmotube Pro and Flow 2. Firstly, let’s see the PM10 measurements as the reference monitor Met One Instrument BAM 1020 (~18,000€) only provided the PM10 concentrations. The air inlet for the PM10 was about a meter away from where the 2 portable AQ monitors were placed and this is one of the reasons we can see that the concentrations from the BAM 1020 were much higher than the low-cost sensors.

Atmotube was able to follow the same trajectory as the BAM 1020 and when I multiply by x3.0 the output concentrations of the Atmotube the trend was much more similar (see graph below). On the other hand, Flow 2 was not able to keep up with the reference monitor. Flow’s (Yellow) line does not follow the reference monitor and I was unable to find any correlation.

As the BAM PM2.5 measurements are being analysed in a lab right now in order to ensure accuracy by the state I will compare the result in a different post. They gave me an estimation of about a month.
Conclusion
It gives you a level of confidence to know that the little AQ monitor that you carry with you is able to reveal the truth about the air you breathe. Although the results are not perfect they can provide some general guidelines to the users.
Stay tuned for the final PM2.5 comparison, will Flow 2 have better PM2.5 measurements and will Atmotube Pro keep up?
Discover more from See The Air
Subscribe to get the latest posts to your email.

Hi Sotiris, congrats for your nice review. Your results confirm my empirical experience with both Flow and AtmoTube, which I keep always with me as I go around in Athens, Greece. I have understood that the AtmoTube gives me more accurate results in regards to the PM, and I know this because they change a lot depending on where I am (trafficked road vs more quite road, tavernas vs. clean air inside home with air filters, etc.) whereas the Flow PM’s readings change much less, so they don’t feel to be as accurate. And the NO2 readings by the Flow do exactly as you describe. They get often excited by some chemicals and then take a long time in order to get down again. So my empirical experience makes me rely more on the AtmoTube readings than on the Flow. The only interesting thing of the Flow over the AtmoTube is that at the end of the day you have a map with your whereabouts that shows the pollution levels that you have been through. If AtmoTube did something similar, it would be just perfect!
LikeLiked by 1 person
Hello, your comparasion between these monitors indicates that the Flow’s pm10 sensor doesn’t work. On another hand I read your article comparing Flow and Atmotube and there you don’t compare exactly this aspect. However the pm2.5 graphs overly nicely there. Could you please provide some more information about how the pm10 graphs compare. It well may be a case of a defective flow unit. I really apreciate your work and expenses in providing this information.
LikeLiked by 1 person
Hi,
Thank you for your kind words.
In the first preliminary comparison I didn’t compare the PM10 but only the PM2.5 measurements because I didn’t expect that there will be such a big gap between the PM10 and PM2.5. As I have mentioned on the article, in order to determine the real correlation of a monitor or a sensor, you need at least 3 units and various days to months of data. Maybe some other units from both parties, PlumeLabs and Atmotube, may give different results. That said, I haven’t got the official gravimetric PM2.5 results yet and this is the reason I didn’t include the result for PM2.5 on the article. Stay tuned as I will shed more light on issue soon.
LikeLike
Hi, your site is a really useful read – I really appreciate your thoroughness!
From reading this comparison review, it sounds like getting a flow may not be so sensible. I’m looking for something that’s going to tell me ‘yes, it’s ok to go running’ or ‘stay inside!’ And interested in both pm2.5 and NO2 (thanks London).
Am I understanding your reviews correctly? Many thanks.
LikeLiked by 1 person
Hi James, and thank you for your kind words. The problem is that both devices won’t tell you about air quality until you first go out with them. In this case, you may need an outdoor monitor or a simple app on your phone that will tell you if it is safe or not. Try the Local Haze app for iOS devices. It uses real open-source data from actual outdoor sensors.
Cheers,
Sotirios
LikeLike
Thanks – that makes sense. Do you have a recommendation on a consumer-affordable outdoor monitor?
LikeLike
Contact me via the contact page here on my blog, I need to know some details like where you live, budget, etc.
LikeLike
Hi Sotiris, Thank you for those great reviews! I’m looking forward to the comparison of the pm2.5 result. At this moment I’m torn between both devices. I really like the ux of the Flow device. But I’m worry that the pm values are not trustful. And I mainly want to use it to look the results of my walks in the neighborhood and on my hiking trips. Also I’m curious about the health conditions while sleeping. So I’m doubting about which of the two to choice. Hopefully you could give me advice on that. Many thanks.
LikeLiked by 1 person
[…] long time has passed since I wrote Part 1, and I presented the results for NO2 and PM2.5 measurements between the low-cost sensors and the […]
LikeLike
[…] Low-Cost Portable Monitors vs Reference Monitors Part1 & Part2 […]
LikeLike