Episode 9: Q&A – See The Air | Real Life Stories
This is the last episode of season 1 where I answer your questions!
This is the last episode of season 1 where I answer your questions!
This is the last episode of season 1 where I answer your questions!

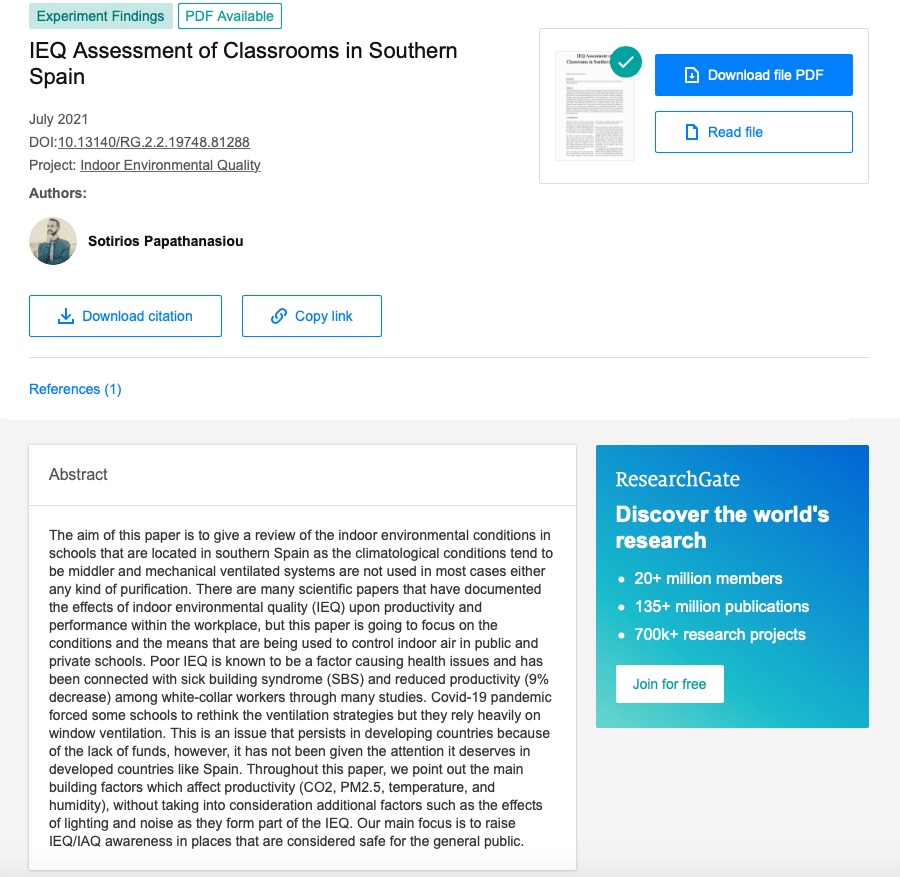
The aim of this paper is to give a review of the indoor environmental conditions in schools that are located in southern Spain as the climatological conditions tend to be middler and mechanical ventilated systems are not used in most cases either any kind of purification. There are many scientific papers that have documented the effects of indoor environmental quality (IEQ) upon productivity and performance within the workplace, but this paper is going to focus on the conditions and the means that are being used to control indoor air in public and private schools. Poor IEQ is known to be a factor causing health issues and has been connected with sick building syndrome (SBS) and reduced productivity (9% decrease) among white-collar workers through many studies. Covid-19 pandemic forced some schools to rethink the ventilation strategies but they rely heavily on window ventilation. This is an issue that persists in developing countries because of the lack of funds, however, it has not been given the attention it deserves in developed countries like Spain. Throughout this paper, we point out the main building factors which affect productivity (CO2, PM2.5, temperature, and humidity), without taking into consideration additional factors such as the effects of lighting and noise as they form part of the IEQ. Our main focus is to raise IEQ/IAQ awareness in places that are considered safe for the general public.
Read about the results and conclusion on ResearchGate.com

On 1st August 2021, I will attempt to travel from Spain to Greece in a hybrid car. I aim to reach my parent’s home (yes, I miss them a lot, damn you covid19) and then return to Spain by sea on a ferry.
It is a month-long road trip of about 3799 km (2360 miles) and I hope I will have the chance to meet new places and during this process, I will document the air quality/pollution in different countries/cities in my effort to raise awareness. I will carry with me a portable air quality monitor that measures, particulate matter (PM1.0/PM2.5), volatile organic compounds (VOC), temperature, and humidity. The monitor is the Atmotube Pro which I have already reviewed here and it correlates very well against reference monitors. Personal and 3rd party field evaluations reveal that the monitor correlates very strongly against GRIMM data PM1.0 r2 ~ 0.93, and PM2.5 r2 ~ 0.89 (1-hr mean). PM2.5 data against a FEM BAM correlate strongly as well r2 ~ 0.78.
I feel confident about the data that I will obtain and as the device saves everything on internal storage and in the phone with GPS coordinates, I won’t lose anything and I will be able to answer some questions, like which counties are more Air Quality friendly based on my data, what was my average exposure to PM during the trip in total and in different countries, or if I had stayed at home, would I have been exposed to less PM, etc. Let’s find the Mediterranean country/city with the cleanest air.
I will visit some cities in Spain, France, Monaco, Italy, Slovenia, Croatia, Bosnia and Herzegovina, Montenegro, Albania, and Greece.

Stay tuned on social media like Twitter and Instagram, as I will post very frequently photos of the trip with AQ data and comments!
Wish me good luck and if you are interested in learning about the air quality in one of the places I will visit or you have any questions please write below.
My guest today is Robert John aka HUMAN SPACEMAN who is a purpose driven entrepreneur, visionary leader and innovator of human health improving solutions for property technology. Many say he was born do to make indoor environment better due to his severe childhood asthma and getting into the air cleaning industry with only 19 years of age. Today, over 20 years later he is the founder of Terraform Global based in London, UK
Linkedin: https://www.linkedin.com/in/robert-john-spaceman/

I am the kind of person that likes things organized and always planned. During the pandemic, I took up hiking as a new hobby. I spend a lot of time indoors working in front of the computer, so I decided that it was time to find an activity in nature where I will be able to look as far away as possible in order to extend my view field and exercise my eyesight. The location I live allows me to do that hobby reality but air quality is not always optimum.
As you may know, I live in southern Spain and although traffic pollution is an issue, when I hike in the hills there is a different type of pollution that may be present, the Saharan Dust. In 2021 I have noticed that cross-border pollution events are more frequent. There are no constant warnings from local media or local authorities about these kinds of events. Newspapers or TV news will only mention them only when there is nothing else to talk about.
So when I want to go outside and practice that sport, I check not only the weather forecast but the air quality forecast from various apps and web services. In this article, I will compare three air quality services and apps that I mostly use and see if they offer an accurate forecast. The apps are eLichens Air, Plume Labs, and Windy.
The method is simple. The night before hiking, I check the AQ forecast with these three apps, and then the next day I check the actual AQ measurements from my sensors and the apps again.

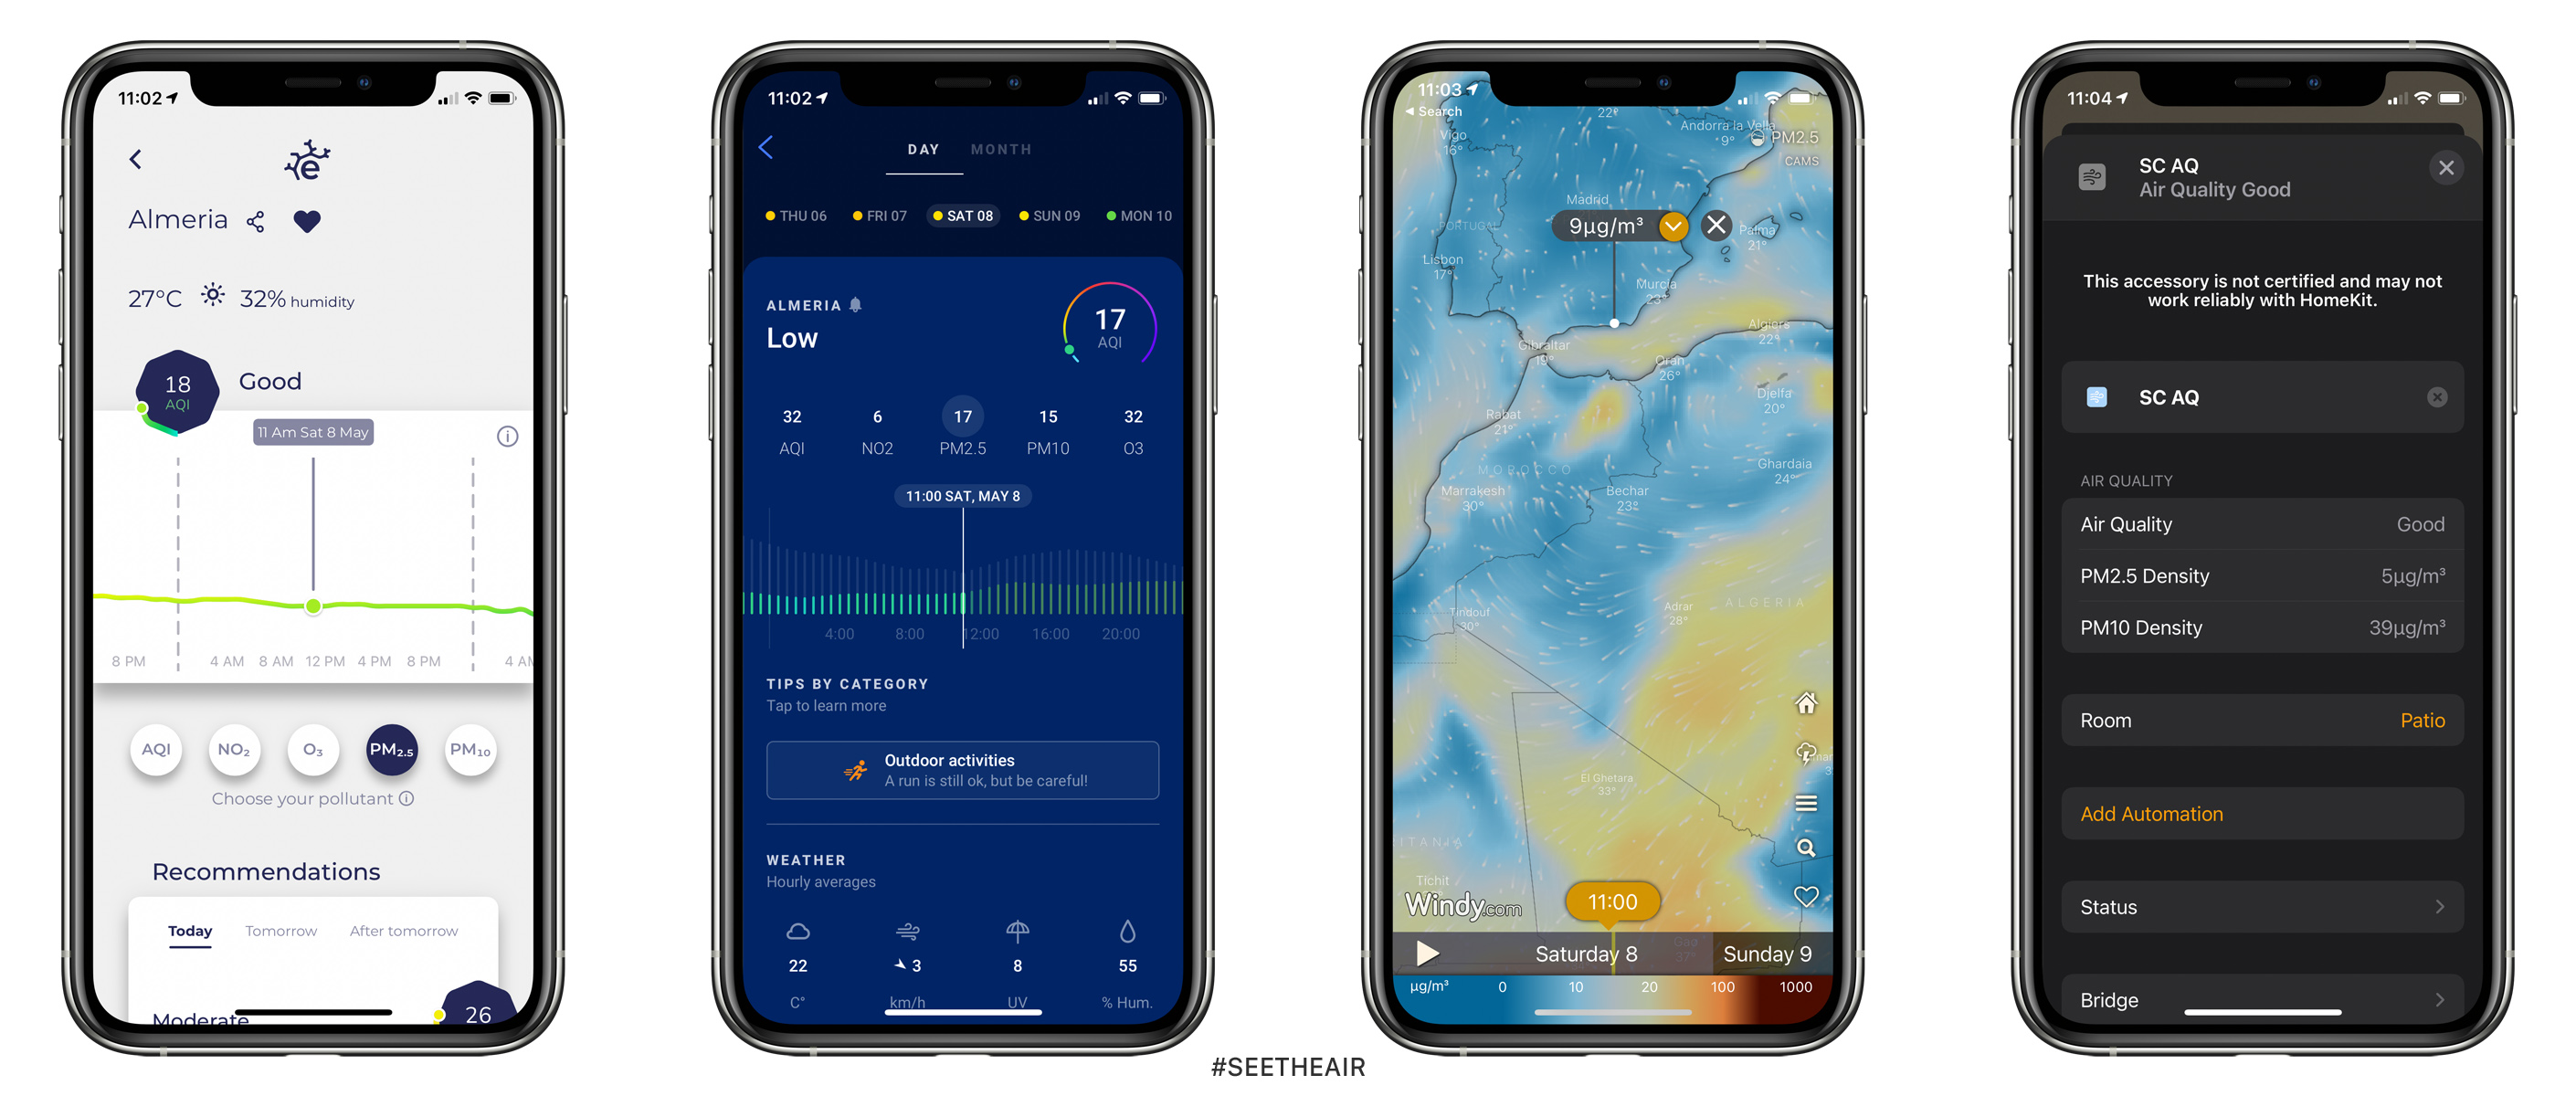
Here is the first comparison. At night of Friday 7th May, I checked the AQ for the next morning at 11am. The forecast data predicted by the Plume Labs and the eLichens Air show an index value and not a mass concentration (μg/m3) like Windy does. In most cases companies use a proprietary AQI and in order to be able to compare them I will need to “decrypt” them. I wasn’t able to find any documentation for the eLichens Air AQI.
Plume Labs gave me an AQI 21 for PM2.5 which according to their documentation corresponds to a value below 25μg/m3. eLichens Air gave me an AQI 16 for PM2.5 which I estimate it corresponds to a value below 12μg/m3. Windy estimated 8μg/m3.
The following day, I checked the measurements at the exact time like the night before plus the real-time values from my outdoor sensors. PM2.5 values were at 5μg/m3 and the eLichens Air, Plume Labs, and Windy gave me almost the same values of 9μg/m3 and 17/18 AQI which are roughly the same.


The second test revealed similar PM2.5 forecast values (20 AQI) between the Plume Labs and the eLichens Air and an estimated value of 14μg/m3 from Windy.
The following morning, the real-time values from the apps were far different from the in-situ values as my outdoor sensor measured 4μg/m3 and the apps gave me a value of 15 AQI and 16μg/m3.
In their defense, there are not lots of available data here because our local AQ station doesn’t share openly PM2.5 data. So they work with models that are not able to give better results. In different parts of the world where spatial coverage is better and official stations share PM2.5 values with the public, they have better results. Some apps rely on satellite imagery, but again satellites pass over Spain once a day and they have a 3.5km by 5km resolution like the sentinel-5 precursor (my favorite so far). I take them into account to make a rough estimation of the following day and of course, I check the data from my local outdoor sensors.
