We all know that cars contribute a lot to air pollution in urban environments, like particulate matter and nitrogen dioxide, among the most common. I see many fellow environmentalists who try to push cities towards a future without cars, but I think with the current means it is very difficult to win the battle.
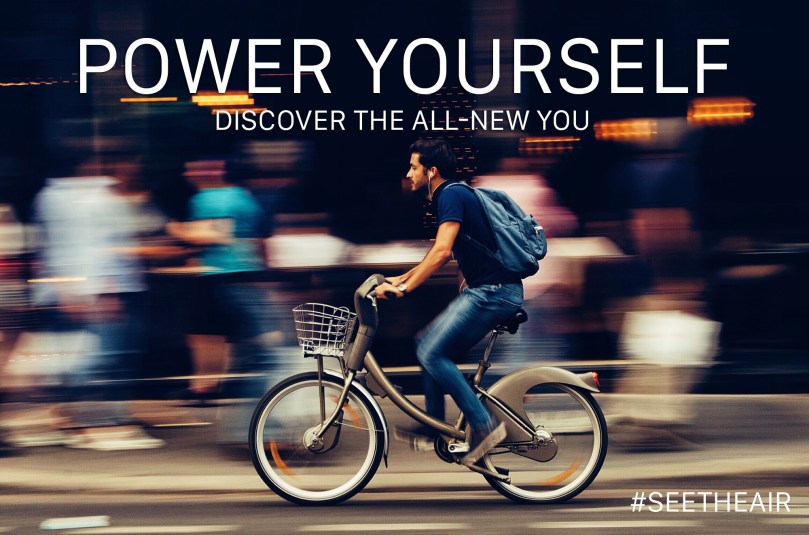
The automotive industry spends millions on advertising, and they always target the emotional connection that forms between a driver and a car. They will never tell you that cars are important tools that will help you on your work or any other everyday tasks, but they will tell you that a car will offer you freedom as you will be able to escape away from your problems or it will make you a powerful human being and so on.
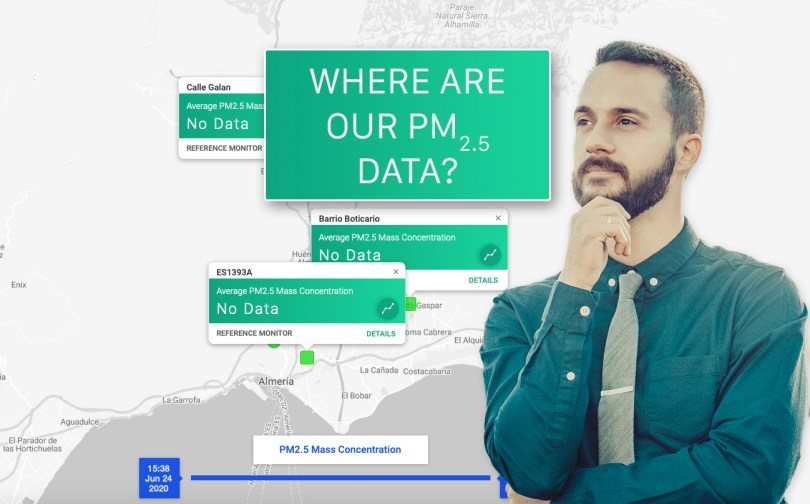
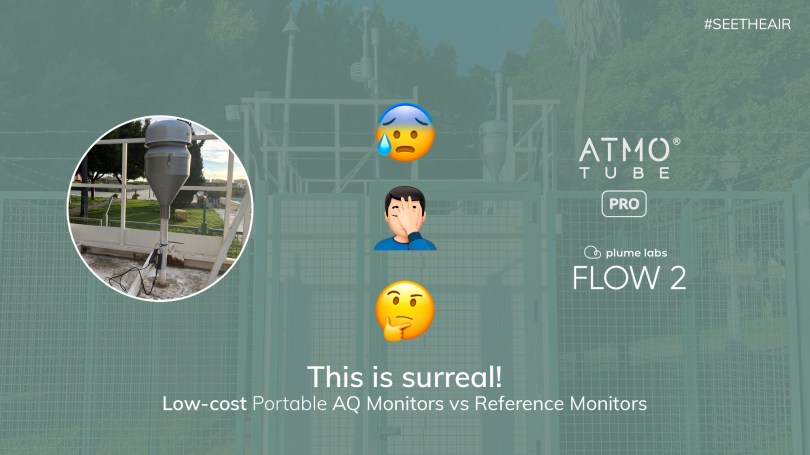
Take, for example, the first three ads I got as a result when I googled “Car ads”. Powerful subliminal messages to lure you into thinking that a car will make you a new person.

When environmental scientists urge communities to leave cars behind they don’t actually do a great job of spreading the message around because they are not trained to do this kind of task. Allow me to elaborate on that. Atmospheric scientists are good at their job which is the study of the Earth’s atmosphere and its various inner-working physical processes. They are able to investigate cases and write papers base on actual facts and among experts, we are able to understand what they want to share but we miss the science of physiology, something that the automotive industry relies on for a century now.
Every day people are not going to read those papers and studies, and if they do, they aren’t going to understand a lot. By giving them the information in a form that they can understand, and without alarming them, we have more chances of making them understand the issue.
Conclusion
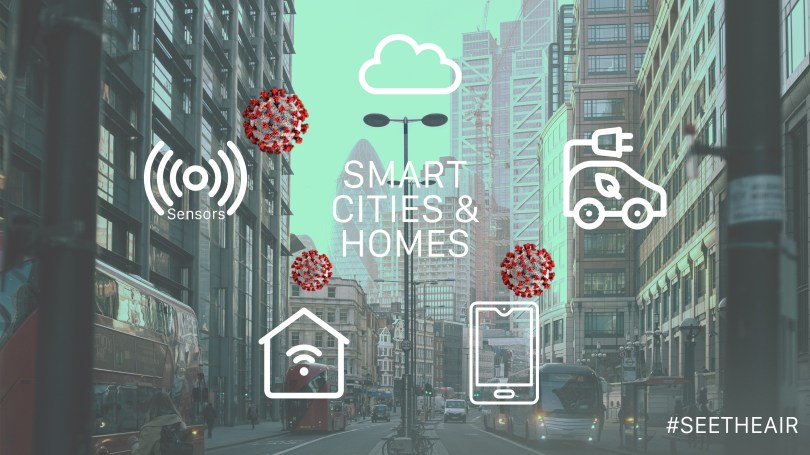
When carmakers launch new cars on the market, they are going to involve many more experts on how to make their product more appealing to the costumers, aka everyday people, as a result, we have to fight with the same tools and team up with marketing experts.
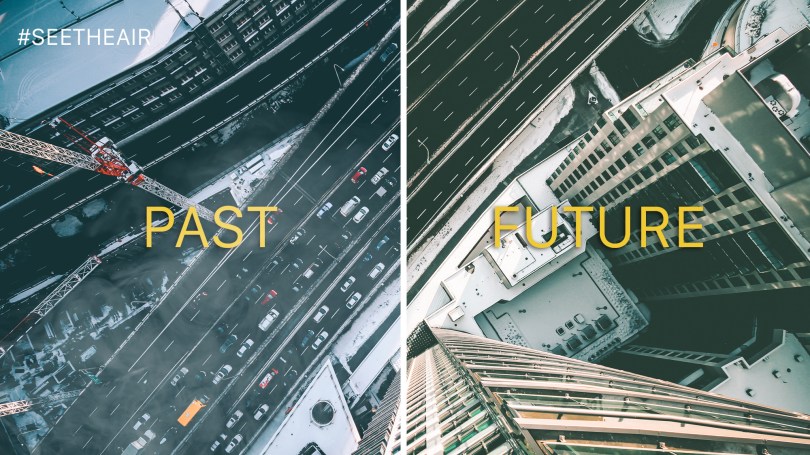
Examples of campaigns, we can deploy if we want more people to join the #CarFree movement. Feel free to share them!