Episode 9: Q&A – See The Air | Real Life Stories
This is the last episode of season 1 where I answer your questions!
This is the last episode of season 1 where I answer your questions!
This is the last episode of season 1 where I answer your questions!

On 1st August 2021, I will attempt to travel from Spain to Greece in a hybrid car. I aim to reach my parent’s home (yes, I miss them a lot, damn you covid19) and then return to Spain by sea on a ferry.
It is a month-long road trip of about 3799 km (2360 miles) and I hope I will have the chance to meet new places and during this process, I will document the air quality/pollution in different countries/cities in my effort to raise awareness. I will carry with me a portable air quality monitor that measures, particulate matter (PM1.0/PM2.5), volatile organic compounds (VOC), temperature, and humidity. The monitor is the Atmotube Pro which I have already reviewed here and it correlates very well against reference monitors. Personal and 3rd party field evaluations reveal that the monitor correlates very strongly against GRIMM data PM1.0 r2 ~ 0.93, and PM2.5 r2 ~ 0.89 (1-hr mean). PM2.5 data against a FEM BAM correlate strongly as well r2 ~ 0.78.
I feel confident about the data that I will obtain and as the device saves everything on internal storage and in the phone with GPS coordinates, I won’t lose anything and I will be able to answer some questions, like which counties are more Air Quality friendly based on my data, what was my average exposure to PM during the trip in total and in different countries, or if I had stayed at home, would I have been exposed to less PM, etc. Let’s find the Mediterranean country/city with the cleanest air.
I will visit some cities in Spain, France, Monaco, Italy, Slovenia, Croatia, Bosnia and Herzegovina, Montenegro, Albania, and Greece.

Stay tuned on social media like Twitter and Instagram, as I will post very frequently photos of the trip with AQ data and comments!
Wish me good luck and if you are interested in learning about the air quality in one of the places I will visit or you have any questions please write below.
My guest today is Robert John aka HUMAN SPACEMAN who is a purpose driven entrepreneur, visionary leader and innovator of human health improving solutions for property technology. Many say he was born do to make indoor environment better due to his severe childhood asthma and getting into the air cleaning industry with only 19 years of age. Today, over 20 years later he is the founder of Terraform Global based in London, UK
Linkedin: https://www.linkedin.com/in/robert-john-spaceman/

I am the kind of person that likes things organized and always planned. During the pandemic, I took up hiking as a new hobby. I spend a lot of time indoors working in front of the computer, so I decided that it was time to find an activity in nature where I will be able to look as far away as possible in order to extend my view field and exercise my eyesight. The location I live allows me to do that hobby reality but air quality is not always optimum.
As you may know, I live in southern Spain and although traffic pollution is an issue, when I hike in the hills there is a different type of pollution that may be present, the Saharan Dust. In 2021 I have noticed that cross-border pollution events are more frequent. There are no constant warnings from local media or local authorities about these kinds of events. Newspapers or TV news will only mention them only when there is nothing else to talk about.
So when I want to go outside and practice that sport, I check not only the weather forecast but the air quality forecast from various apps and web services. In this article, I will compare three air quality services and apps that I mostly use and see if they offer an accurate forecast. The apps are eLichens Air, Plume Labs, and Windy.
The method is simple. The night before hiking, I check the AQ forecast with these three apps, and then the next day I check the actual AQ measurements from my sensors and the apps again.

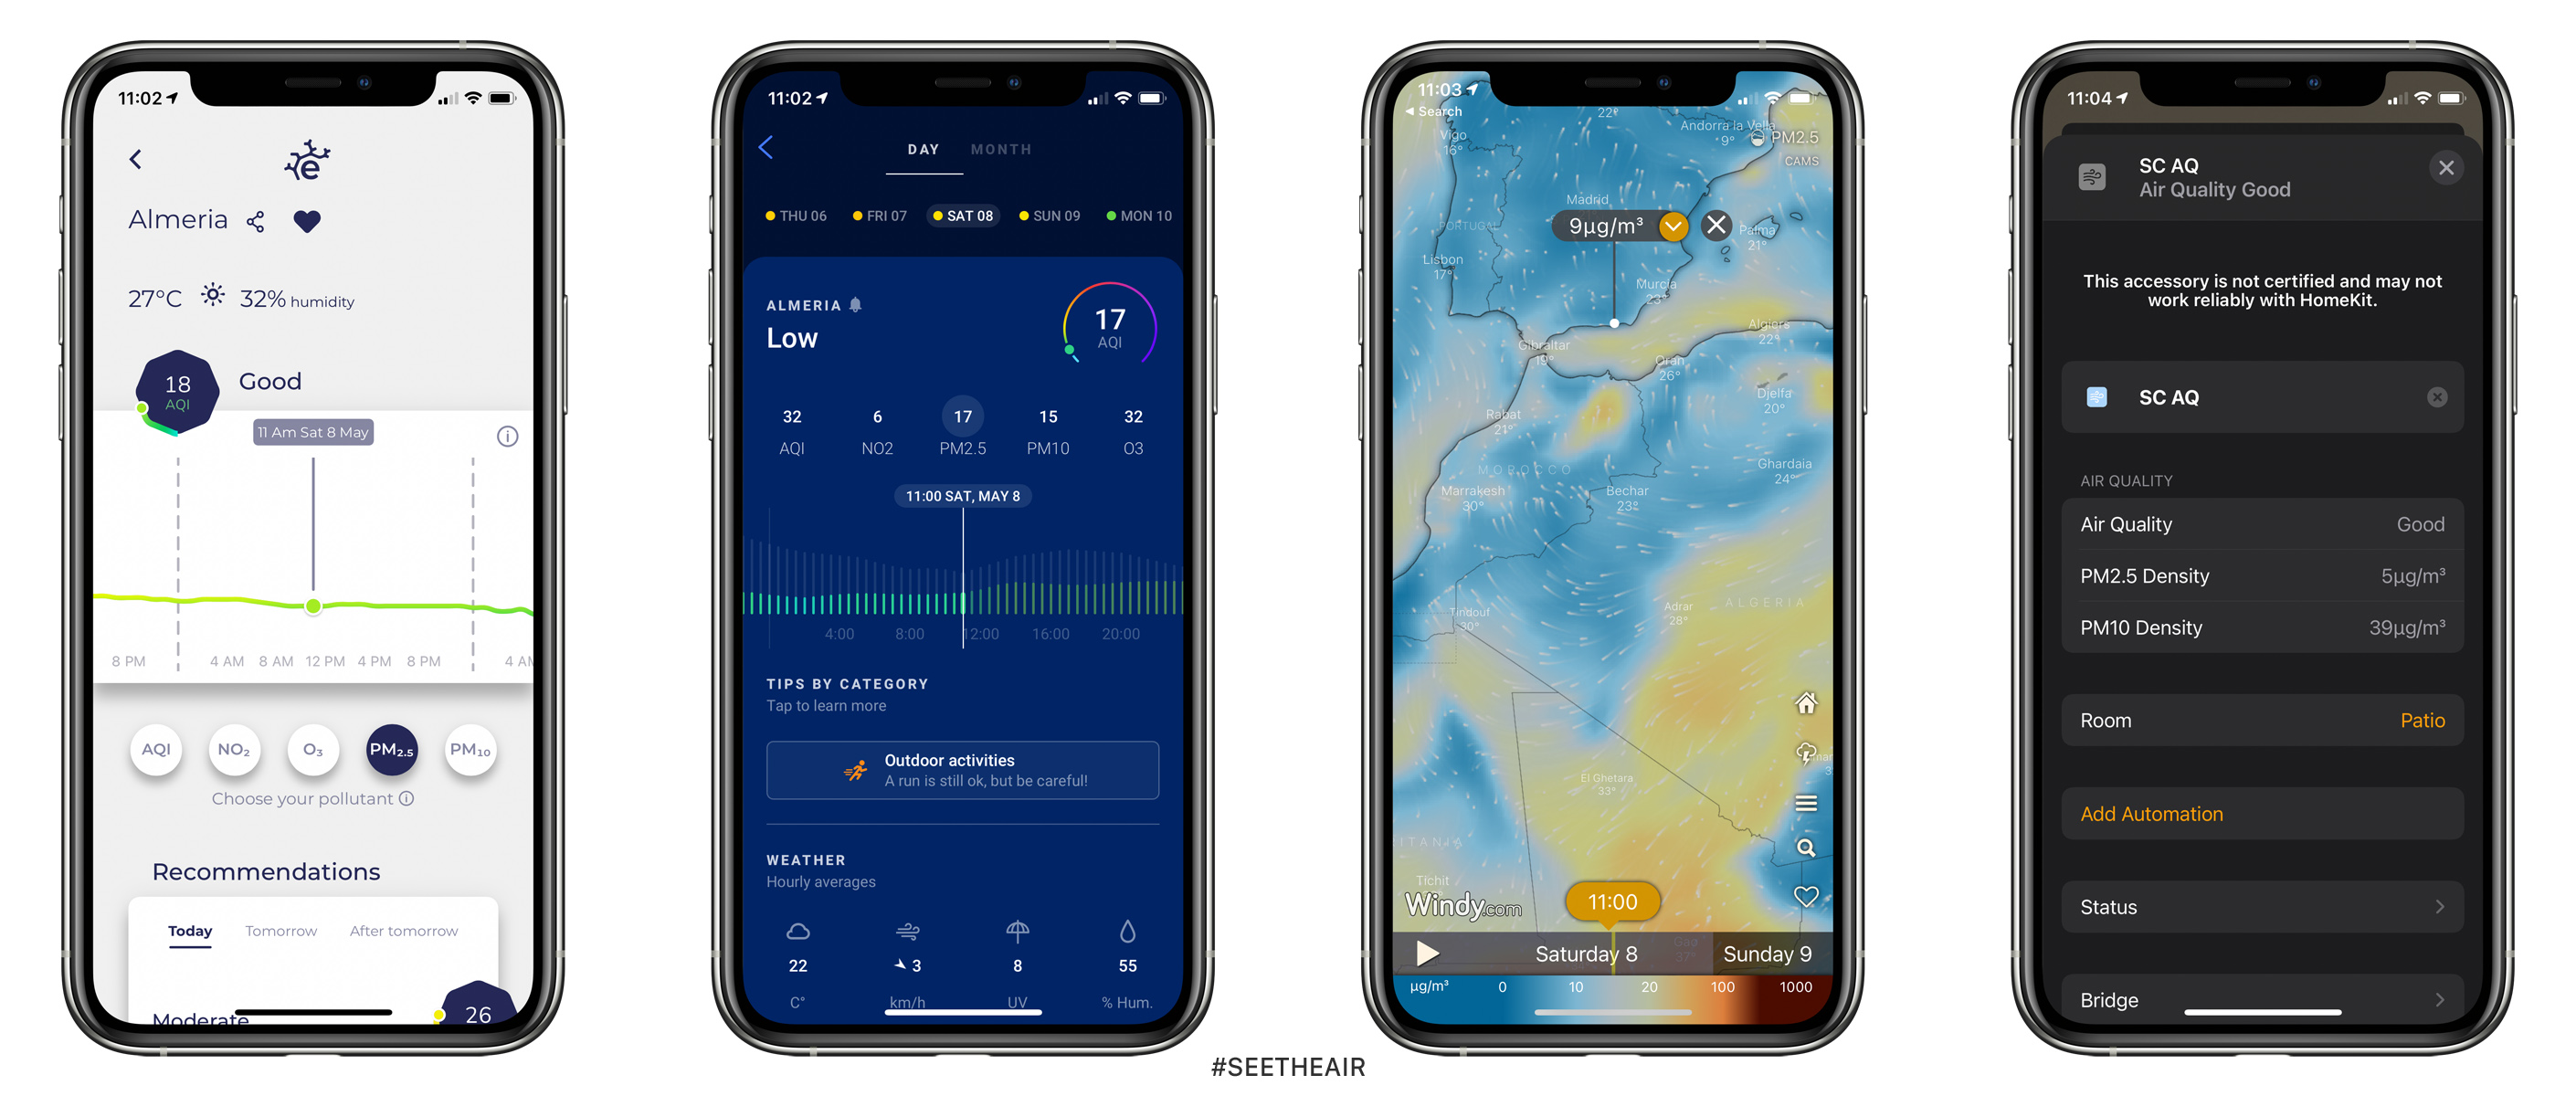
Here is the first comparison. At night of Friday 7th May, I checked the AQ for the next morning at 11am. The forecast data predicted by the Plume Labs and the eLichens Air show an index value and not a mass concentration (μg/m3) like Windy does. In most cases companies use a proprietary AQI and in order to be able to compare them I will need to “decrypt” them. I wasn’t able to find any documentation for the eLichens Air AQI.
Plume Labs gave me an AQI 21 for PM2.5 which according to their documentation corresponds to a value below 25μg/m3. eLichens Air gave me an AQI 16 for PM2.5 which I estimate it corresponds to a value below 12μg/m3. Windy estimated 8μg/m3.
The following day, I checked the measurements at the exact time like the night before plus the real-time values from my outdoor sensors. PM2.5 values were at 5μg/m3 and the eLichens Air, Plume Labs, and Windy gave me almost the same values of 9μg/m3 and 17/18 AQI which are roughly the same.


The second test revealed similar PM2.5 forecast values (20 AQI) between the Plume Labs and the eLichens Air and an estimated value of 14μg/m3 from Windy.
The following morning, the real-time values from the apps were far different from the in-situ values as my outdoor sensor measured 4μg/m3 and the apps gave me a value of 15 AQI and 16μg/m3.
In their defense, there are not lots of available data here because our local AQ station doesn’t share openly PM2.5 data. So they work with models that are not able to give better results. In different parts of the world where spatial coverage is better and official stations share PM2.5 values with the public, they have better results. Some apps rely on satellite imagery, but again satellites pass over Spain once a day and they have a 3.5km by 5km resolution like the sentinel-5 precursor (my favorite so far). I take them into account to make a rough estimation of the following day and of course, I check the data from my local outdoor sensors.
My guest today is Christian Saravia who is an Industrial Engineer, Master’s Degree in Water Resources Management; Postgraduate in Environmental Management from the University of Dresden Germany; Founder of the scientific project A M B E N T E in Guatemala.
This episode is available in English and Spanish.
Linkedin: https://www.linkedin.com/in/christian-saravia-s/
Twitter: @Chrisaravia
After the fiasco with the exposure notifications on smartphones which was designed by Apple and Google to facilitate digital contact tracing during the COVID-19 pandemic, we realized that governments weren’t ready to accept the terms of the service for privacy reasons probably and also users weren’t keen on enabling such feature probably for the same reasons.
We have to be able to monitor the situation in indoor environments beyond the location of an individual and we already do that with air quality monitors. Indoor air quality monitors help us see the air we are exposed to and when something isn’t right like high CO2 concentrations, we get notified to act by opening the windows or turning on the ventilation system, or eventually leaving the room if none of the latter are an option.
I propose to bring that kind of awareness to the indoor environments of transports, especially, in long-distance buses, airplanes, and trains as we spend substation time inside these transports and we all share the same air.
Most vehicles allow drivers to choose between outdoor air or recycled air. They never ever mention the benefits of fresh air (but not clean) to the drivers, so in most cases, drivers never change the settings. Have you ever been in a car for a long time, having the recycled air turned on? The drivers always complain about the lack of focus or energy and many passengers fall asleep. In most cases, this is due to the lack of oxygen and the high CO2 concentration which is scientifically proved to affect and decrease cognitive function.
The same thing applies inside an airplane. However, the pilots get the most oxygen from the rest of the occupants in the plane, but still, I am not sure if the bus drivers know about the indoor air quality (IAQ) of their buses and the outdoor air or where is the recycled air switch.
Not only that, we know that CO2 is a great indicator of ventilation rates and consequently indicates the viral load inside a transport. A viral load is a numerical expression of the quantity of virus in a given volume of air. The higher the viral load the most likely is to catch the virus, any virus, or pathogen.
Air quality data like CO2/PM2.5 are not as privacy-sensitive as location information and they can help us in mitigating the spread of diseases and improving our cognitive abilities and health. Clean air means healthy lungs, heart, and brain.
Indoor air quality monitors are relatively inexpensive and CO2 sensors can operate for up to 15 years. They will also reveal the truth about the air we breathe in cities. I know that not many council members want people to know that the air they are exposed to daily is poor and unhealthy but if you are a good politician with real morals and compassion for your fellow dwellers then you want the best for them.
So maybe it is time to start designing indoor air quality monitors for transports. They can work offline or online depending on the transport. Passengers can access the information as their ticket can host a QR code with the link of the specific monitor/transport/route. In the case of an off-line monitor then a display with clear readings will allow passengers and the staff/cabin crew of the transport to adjust the indoor conditions.
My guest today is Abhiir an active youth environmentalist from India.
Abhiir has worked on climate change for over 8 years – particularly on air pollution and waste segregation and has been identified by the BBC as among the foremost international youth environmentalists.
Twitter: @abhiirbhalla
Linkedin: https://www.linkedin.com/in/abhiirbhalla/
In this episode, James Heydon, who lives in Sheffield UK, will share with us his professional thoughts on air pollution.
James is an Assistant Professor in Criminology.
You may think, how can a criminologist shed light on air pollution!
Well, James is currently researching air pollution regulations, and his academic studies in human behavior could help us understand better why most people neglect to think about the air they breathe.
Twitter: @Jwheydon

I love combining technologies and services because this is a great and inexpensive way for companies to expand their businesses and for users to have a better experience. Awair has developed a great B2B air quality monitor the OMNI (hardware) and Djinn has developed a great B2B service (software) that combined together may offer better AQ insights or in other words, they contextualize data.
So I took the liberty to use the API Awair provides to its users and integrate it into Djinn’s platform. The reason is simple, Awair measures a plethora of parameters (temperature, humidity, PM2.5, VOC, CO2, noise, and light), and Djinn provides better insights into the impact those various indoor environmental parameters have on our health, like cardiovascular health risk and allergy risk. However, they also provide the productivity index which estimates the quality of the indoor environment with regard to the influence on productivity.
In real-life situations (offices, classrooms, etc) low-quality indoor environments may result in productivity drop up to 10% and more. Often in such cases, indoor environment quality is not comprehended by a person during the work process. The productivity index is based on research by cognitive scientists from various Universities.
According to the researchers, Human Decision Making Performance may be divided into different cognitive functions. Djinn service is able not only to estimate a general level of productivity, called Integral Productivity Index (IPI) but specify it for 9 cognitive activity areas based on research. An IPI is calculated as the average of all 9 directions. Those different models allow you to tune indoor parameters for optimal productivity according to your needs.
Read More »
I have come to the conclusion that rankings of cities by air pollution are not accurate and they don’t reflect the real situation in large communities because if you are unlucky enough to have a careless neighbor that burns wood/garbage/etc or you live outside the Low Traffic Neighborhoods (LTNs) and official AQ stations are far away from you then you are screwed!
Basically, your health is a subject of what others want, and there is little you can do to protect yourself. You can always stay indoors with purifies all over the house 24/7 and unable to open a window for oxygenated air to come inside. That is not correct as your freedom to open a window or walk outside your house and the right to breathe clean air are taken from you.
There are many studies talking about inequality in low-income communities. In a recent study researchers have even identified the fact that there are less trees around poor communities than in high-income ones.
Politicians marginalize the work-class constantly by refusing to find solutions to their problems. Some laws protect us from air pollution but they are not enforced. So far scientists have gathered hundred of evidence that tells us firmly that air pollution kills – more than 7 million people have died prematurely worldwide due to air pollution. Personally, death doesn’t scare me, but living a life with many medications and unable to function as a human being (Alzheimer’s among some of the most common diseases) is my biggest fear and air pollution can decrease the quality of life. It is hard to quantify morbidity which means the condition of suffering from a disease or medical condition. This is not the future I want for myself and the people around me and you shouldn’t too.
Read More »