The landscape of air quality monitoring is shifting. For years, the focus remained on PM2.5 and PM10 (mass concentration), but we are increasingly realizing that the most dangerous threats are the ones we can’t weigh. Ultrafine particles (UFPs), or nanoparticles, are so small they penetrate deep into the bloodstream, yet they often escape traditional sensors and regulatory implementations.
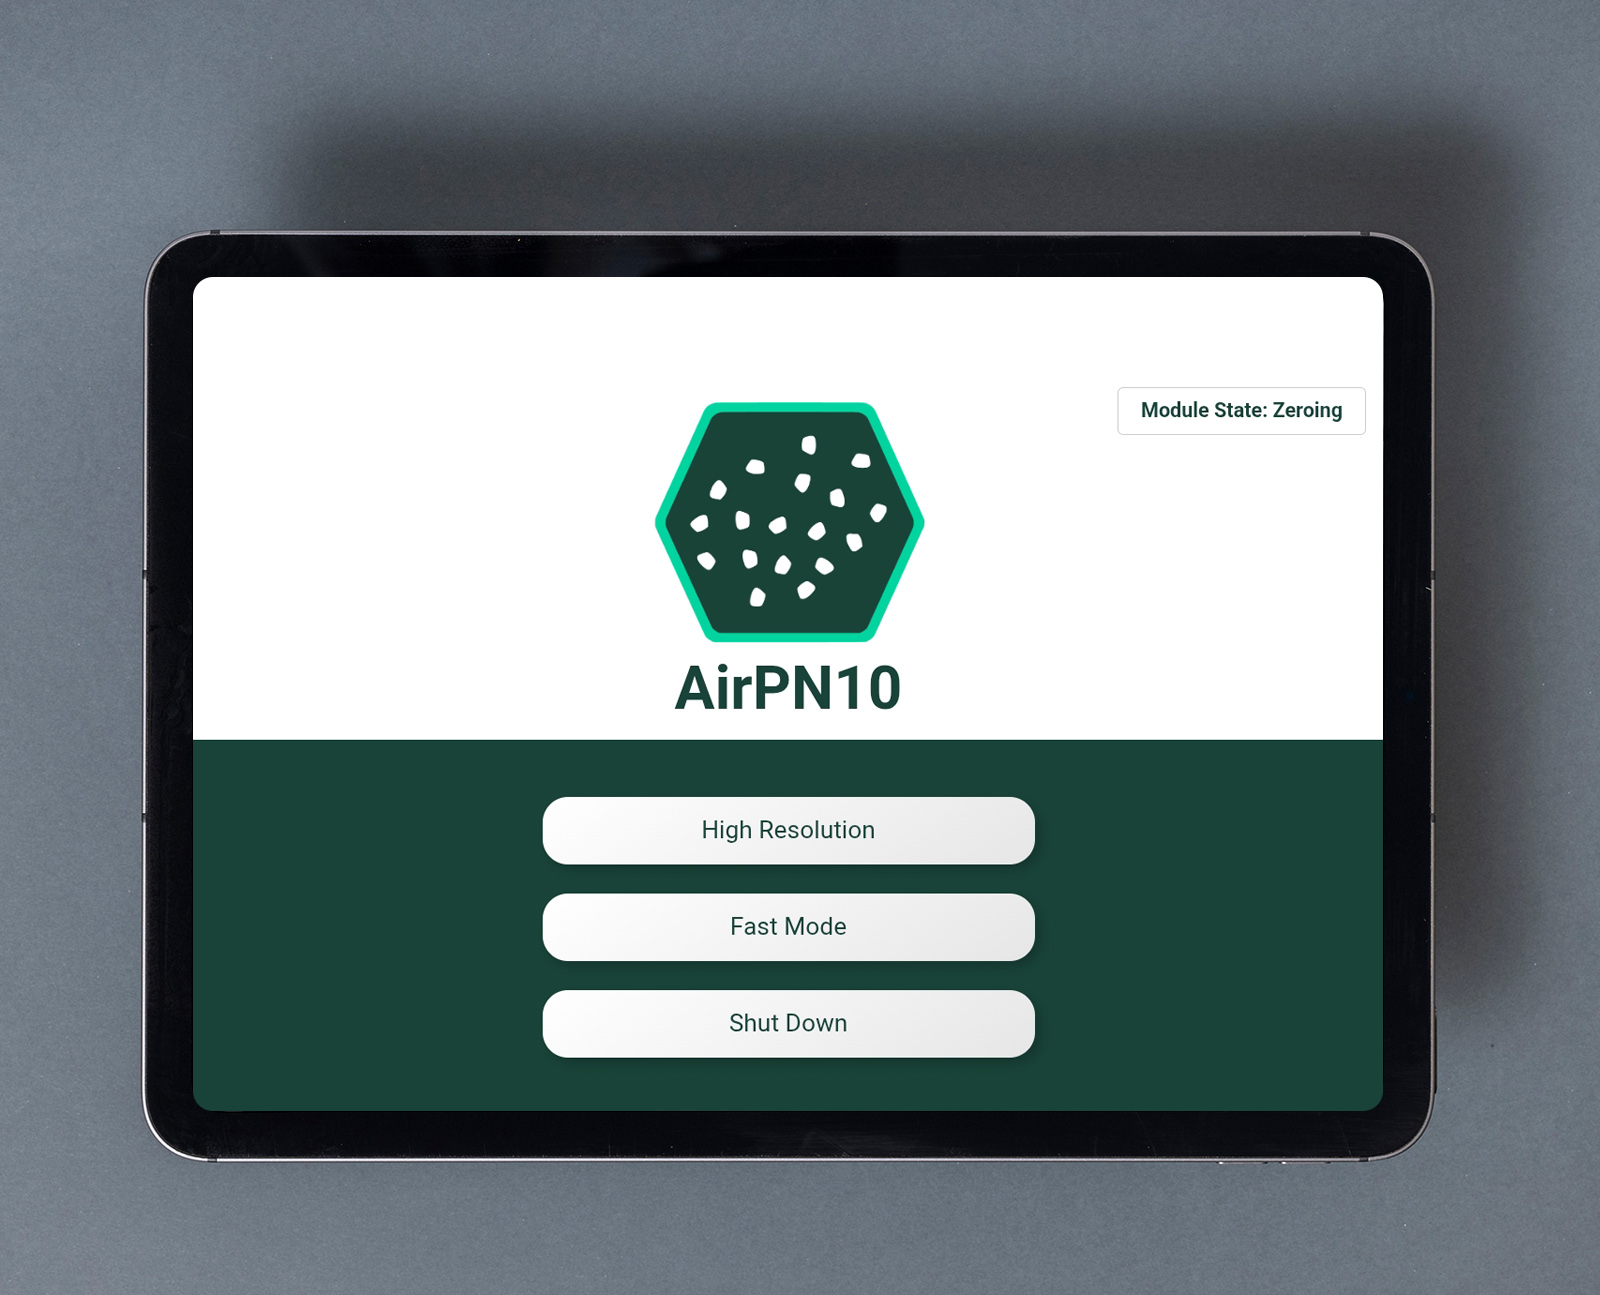
Enter the nanoDUST AirPN10. Designed as a “Plug & Play” solution for monitoring these invisible threats, it promises to bring lab-grade accuracy to the field without the logistical headaches of traditional counters.
Technical Specifications
The nanoDUST AirPN10 is built for high-precision air monitoring. Its standout feature is its independence from working fluids, unlike Condensation Particle Counters (CPC) that require constant refills of butanol or water.
- Measurement Range: 1,000 to 500,000 particles/cm³
- Lower Detection Limit: D50 at 10 nm
- Technology: Advanced Diffusion Charging (ADC)
- Aerosol Handling: Integrated Aerosol Switching Technology (AST) for solid vs. volatile separation.
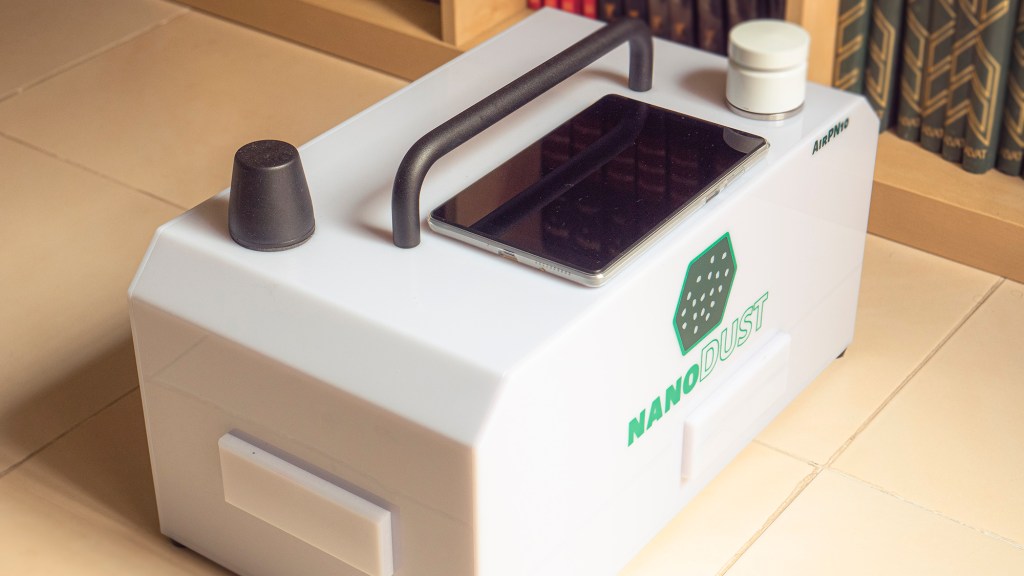
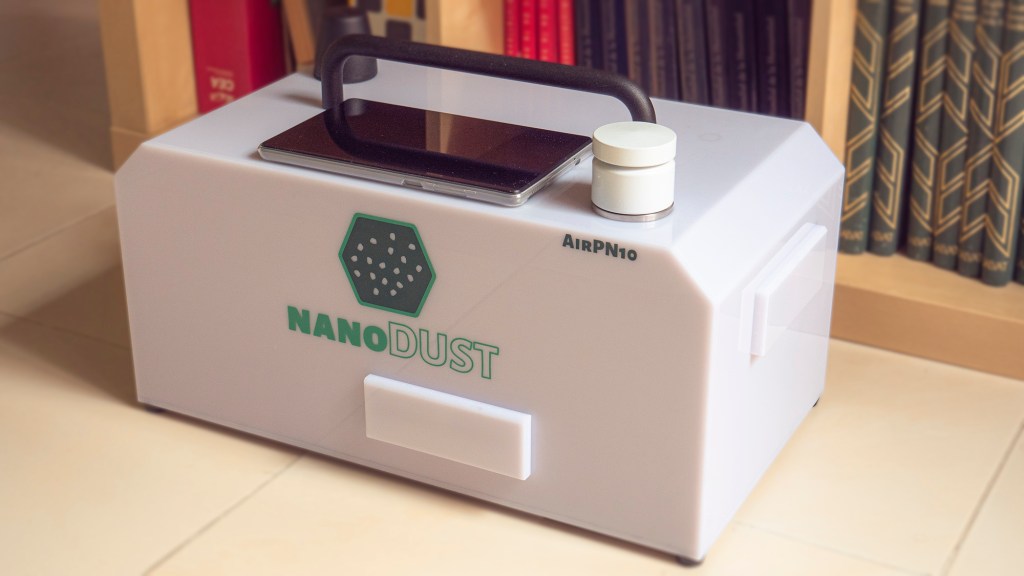
- Weight: ∼9 kg
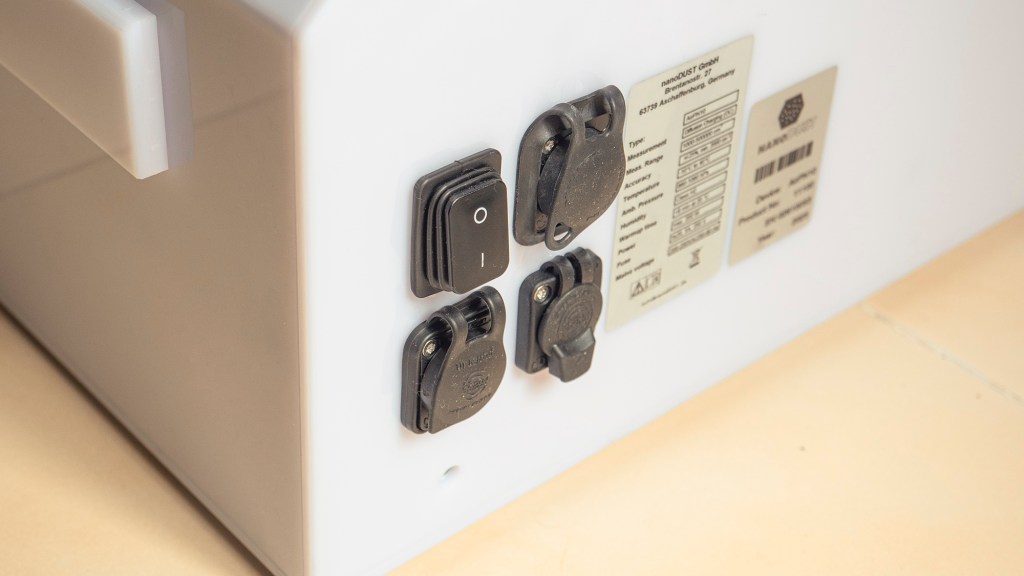
- Connectivity: LTE (Cloud), LAN (Ethernet), and USB.
- Durability: Weatherproofed for outdoor use (when not using the rear USB port).
- Power Consumption: Typically <100 W
- Ingress Protection: IP55 Weatherproof
- Sample Inlet: PM10 Sampling Head
- Calibration Aerosol: Soot
The Innovation: ADC and Aerosol Switching
The “beauty” of the nanoDUST AirPN10 lies in its Advanced Diffusion Charging (ADC). Traditional CPCs work by “growing” particles in a cloud of vapor (butanol or water) until they are large enough to be seen by a laser. ADC skips this entirely by using unipolar ions to charge particles; the resulting current is then measured by a high-sensitivity electrometer.
By employing Aerosol Switching Technology (AST), the device can differentiate between solid particles (like soot from traffic) and volatile fractions (which might evaporate). This is a game-changer for source apportionment, allowing you to tell if your air quality issues are coming from the tailpipe of a truck or local atmospheric chemistry.
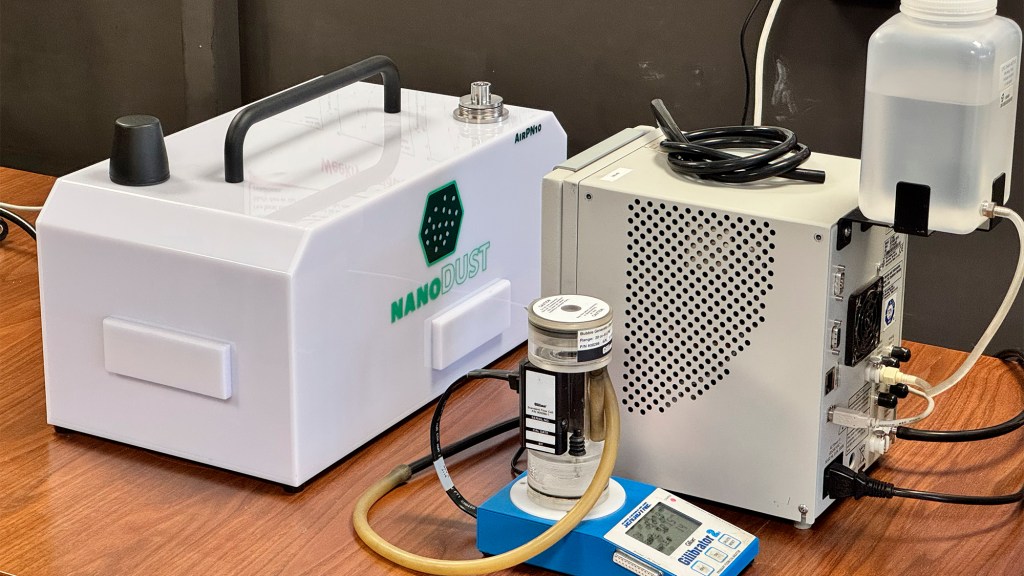
Performance and Validation: The Granada Trials
To verify the instrument’s accuracy or better to get an idea how it behaves in comparison with other common instruments, I collocated the AirPN10 alongside a TSI 3772 CPC at the University of Granada and I thank them for lending their time and instruments. The TSI 3772 is widely used in aerosol research and uses butanol C4H9OH which can be problematic indoors (a different conversation). Disclaimer: The status of calibration for the 3772 was unknown to the researcher in the lab.
What does r2=0.88 mean?
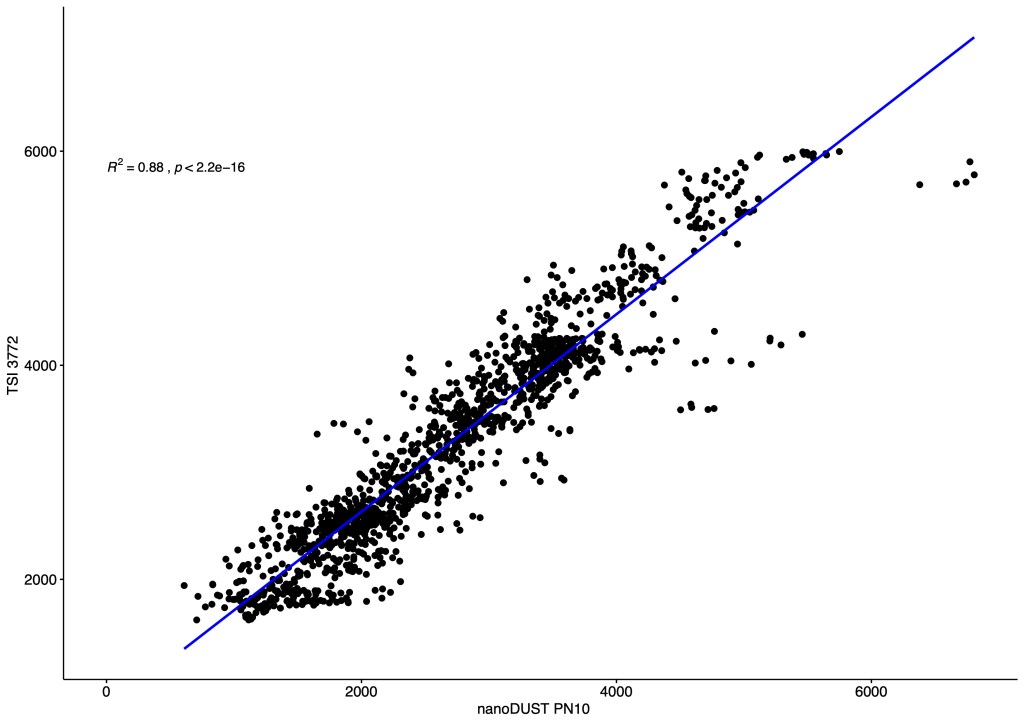
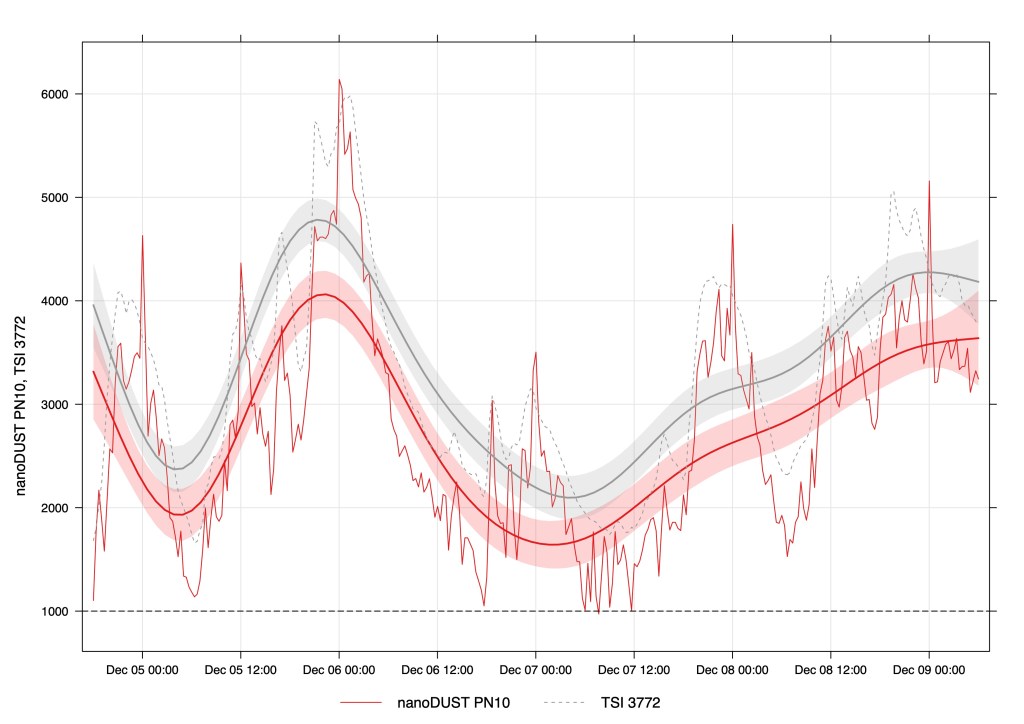
In statistics, the coefficient of determination (r2) measures how well one variable predicts another. An r2 of 0.88 indicates that 88% of the variance in the nanoparticle concentration measured by the TSI was captured by the nanoDUST AirPN10. The AirPN10 tended to underestimate the total particle number (TPN) by about 580 p/cm3. The correlation is robust, as the underestimation falls within the device’s 1.500 p/cm3 absolute uncertainty margin. Keep in mind, in-situ measurements naturally involve more variables and uncertainties than the highly controlled environment of a lab-based comparison.
In the world of field-deployable sensors (which are usually compared against instruments costing three times as much), an r2 of 0.88 is an excellent result. It signifies a strong linear correlation, proving that the nanoDUST AirPN10 is a reliable surrogate for high-end laboratory equipment in real-world conditions.
Real-World Findings: The “Invisible” Threat
I conducted tests in two different households in Spanish cities to see how the nanoDUST AirPN10 handled indoor environments. The findings were startling and highlight why mass-based metrics (PM2.5) can be misleading.
The HEPA Effect vs. The “Clean Air” Paradox
- With HEPA Filtration: Particle Number Concentrations (PNC) remained predictably low.
- Without HEPA Filtration: Even when PM2.5 levels were “excellent” (below 2μg/m3), the nanoparticle count spiked significantly.
In both households, the PNC was well above the WHO good practice recommendations. For context, the WHO suggests:
- Low PNC: < 1.000 particles/cm³ (24-hour mean)
- High PNC: > 10.000 particles/cm³ (24-hour mean)
- High PNC: > 20.000 particles/cm³ (1-hour mean)
In my tests, despite no obvious sources like cooking or smoking, the AirPN10 detected high concentrations that traditional PM2.5 sensors simply ignored. This suggests that “clean” air (by mass standards) can still be heavily “polluted” by nanoparticles. A more detailed article is going to follow with the test parameters and results so make sure to subscribe to our newsletters.
User Experience: Portability and Interface
The device is surprisingly mobile. While 9 kg isn’t “lightweight,” the ergonomic handle makes it easy to transport between rooms or sites, and the option to pole-mount it is a win for urban planners.
The Feedback Loop
However, there is room for improvement:
- Status Indicators: One notable omission is a visible external LED. In a noisy lab environment, like the one in Granada where multiple instruments are humming, it is difficult to tell if the AirPN10 is actually powered on without checking the screen.
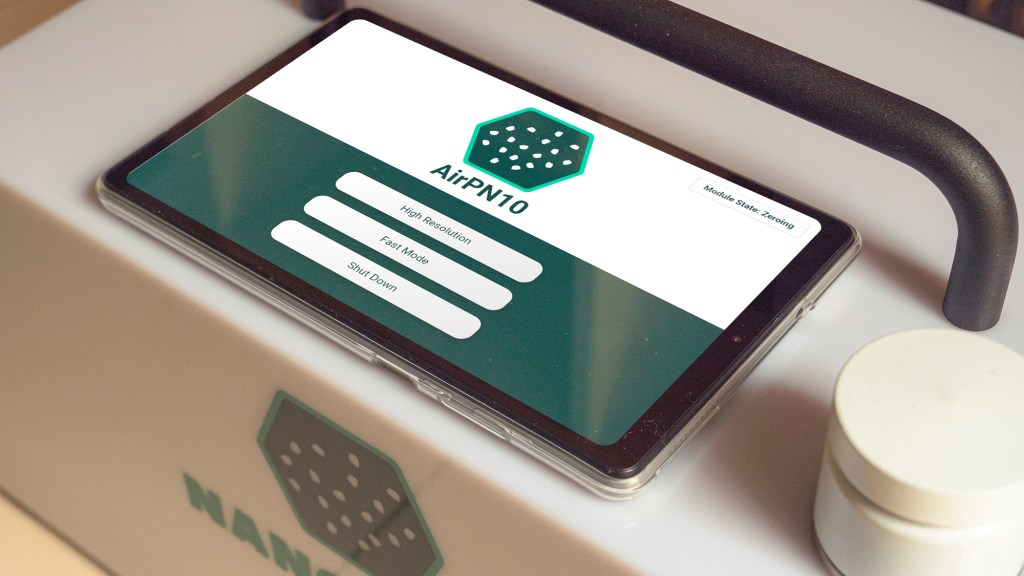
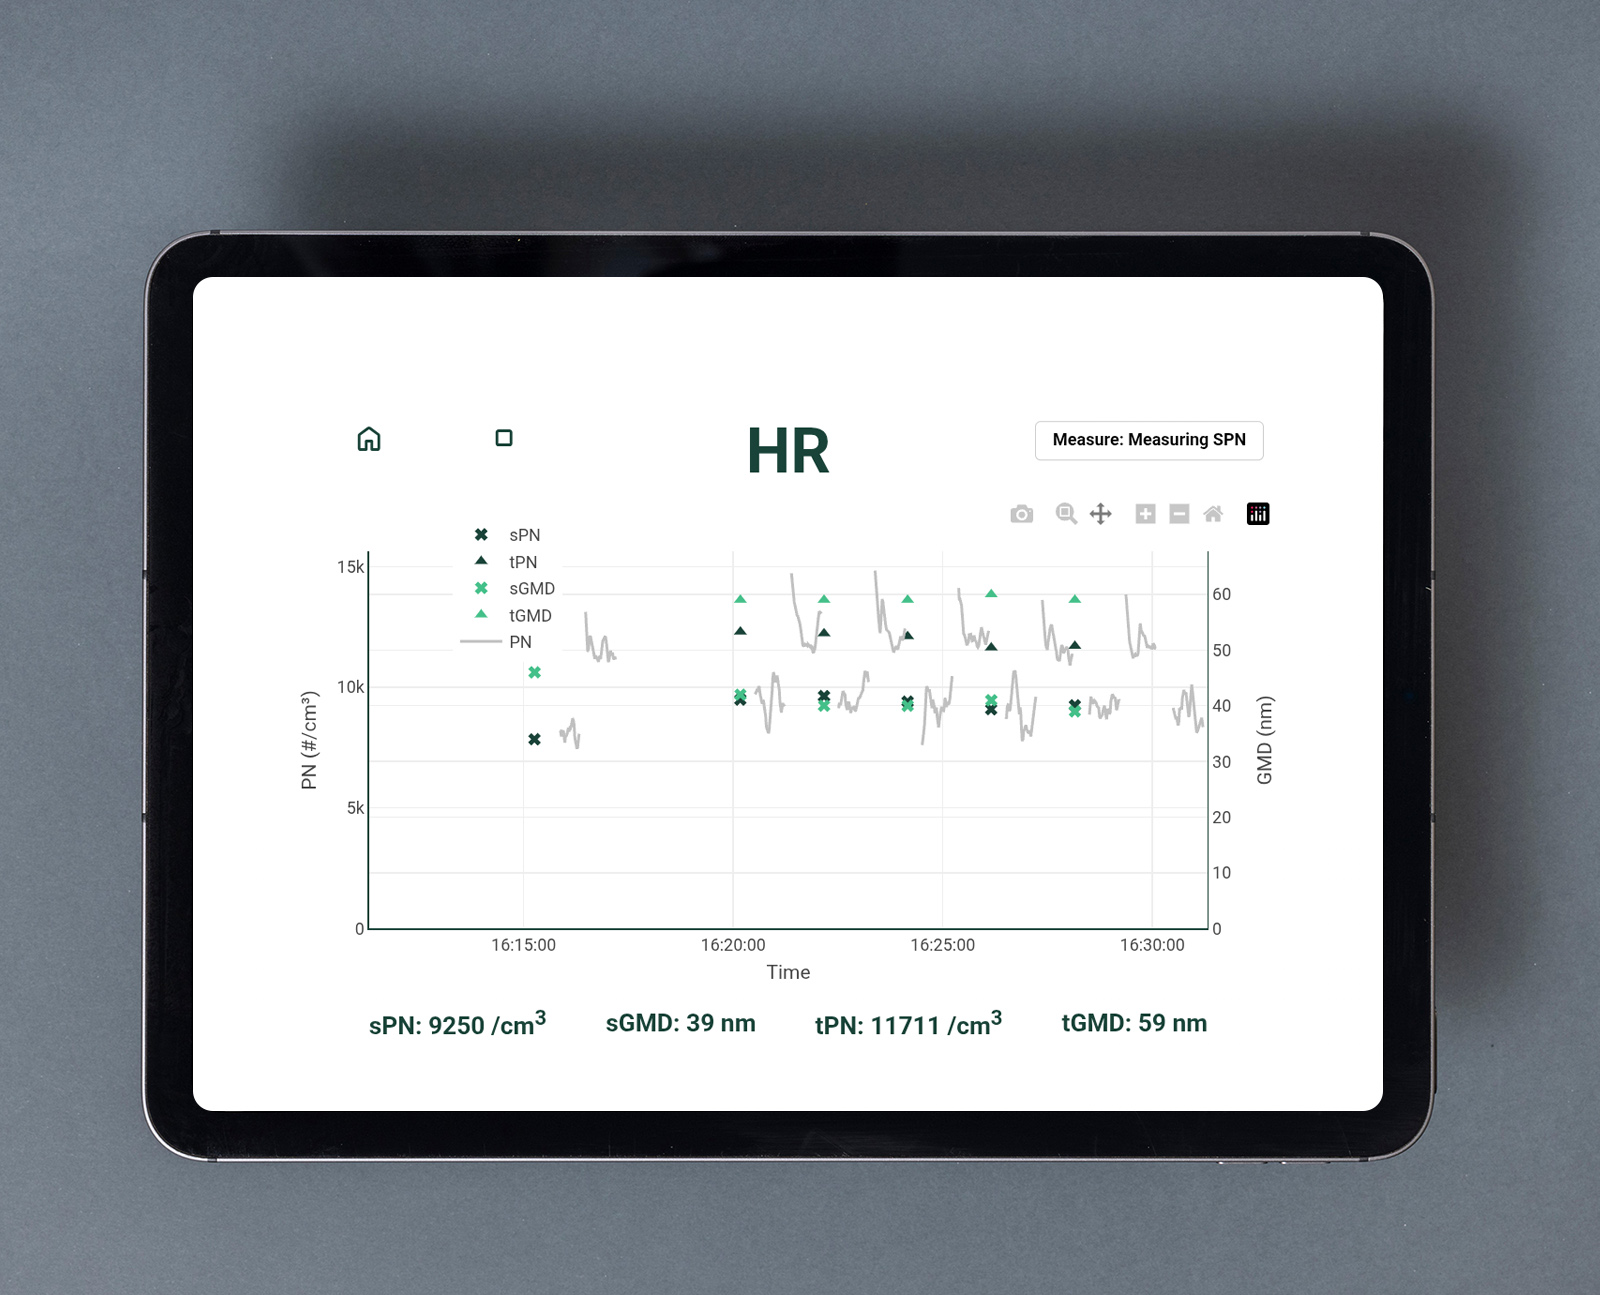
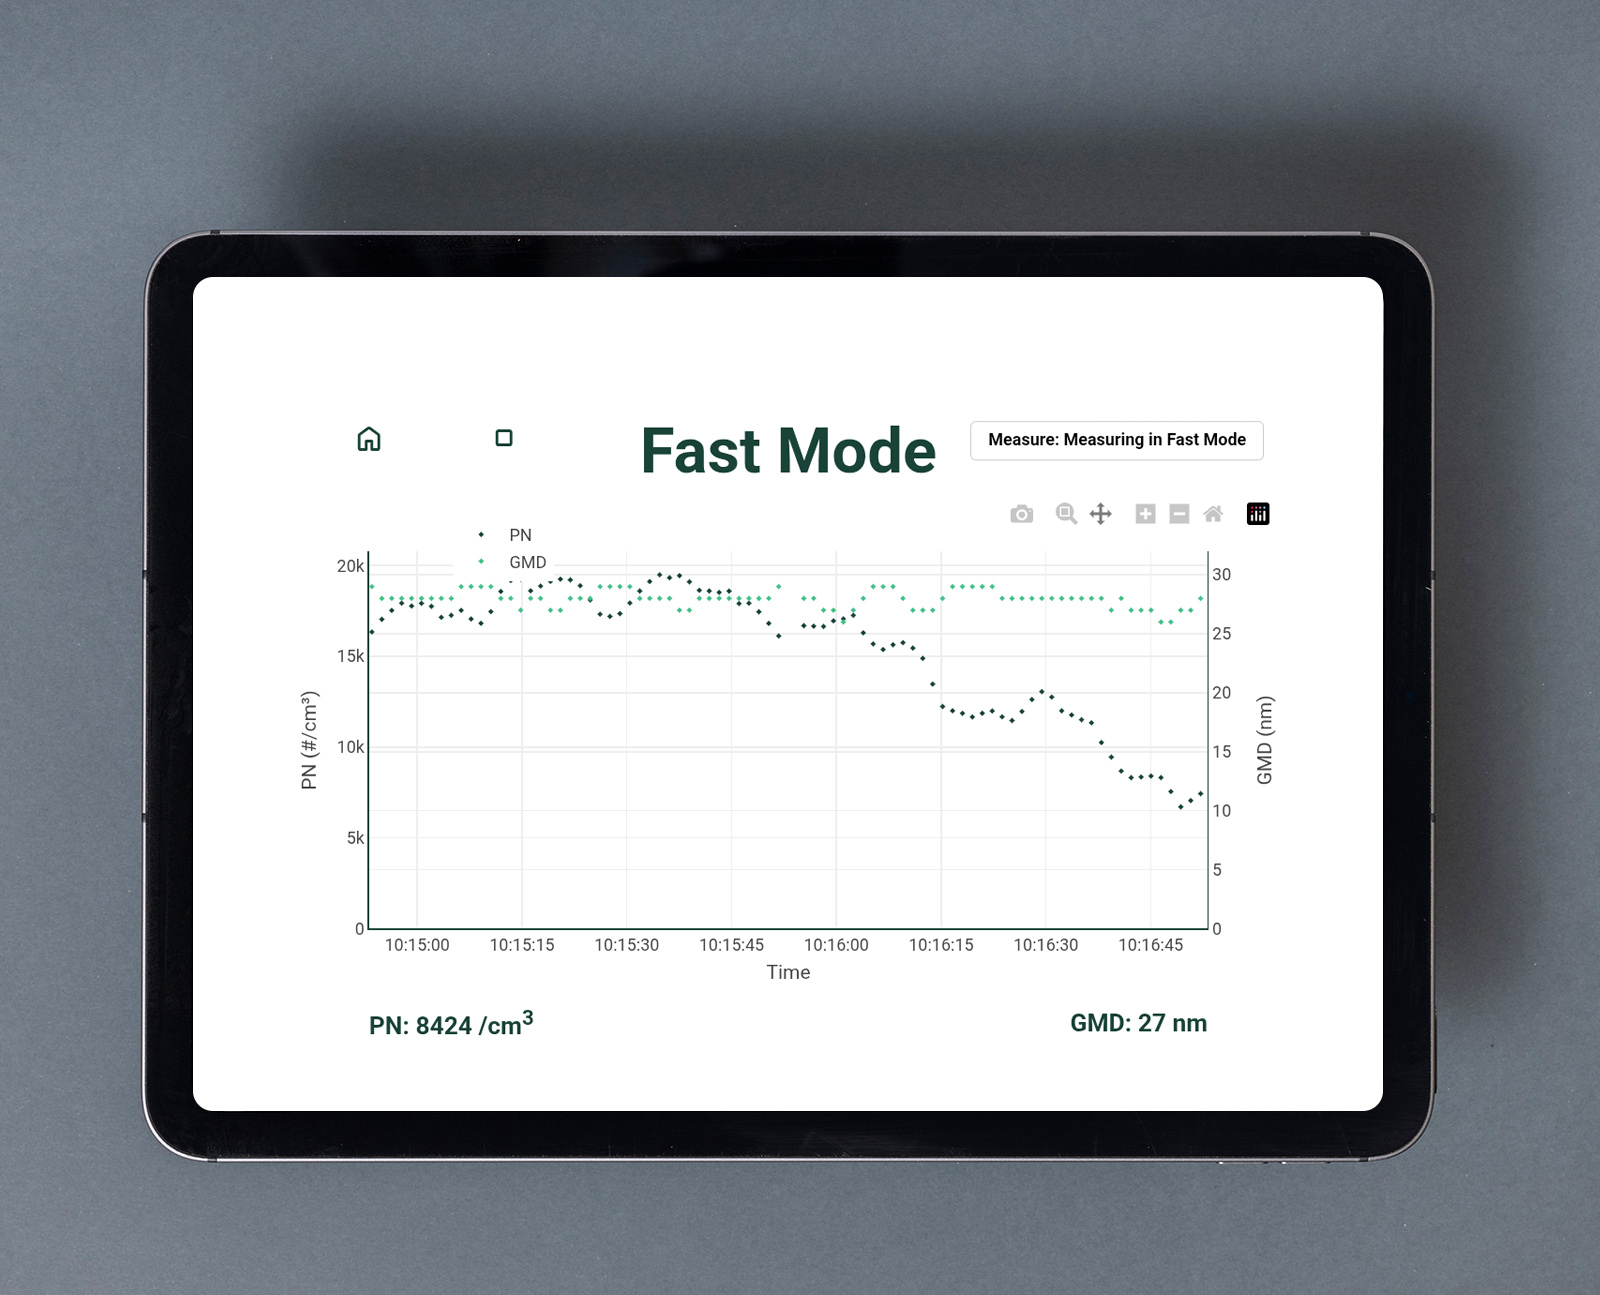
- The Tablet: The included tablet is a fantastic tool for real-time visualization, especially when you don’t want to lug a laptop around. However, the software currently blocks screenshot sharing. This is a missed opportunity for quick field reporting and should be addressed in a software update.
Data Management
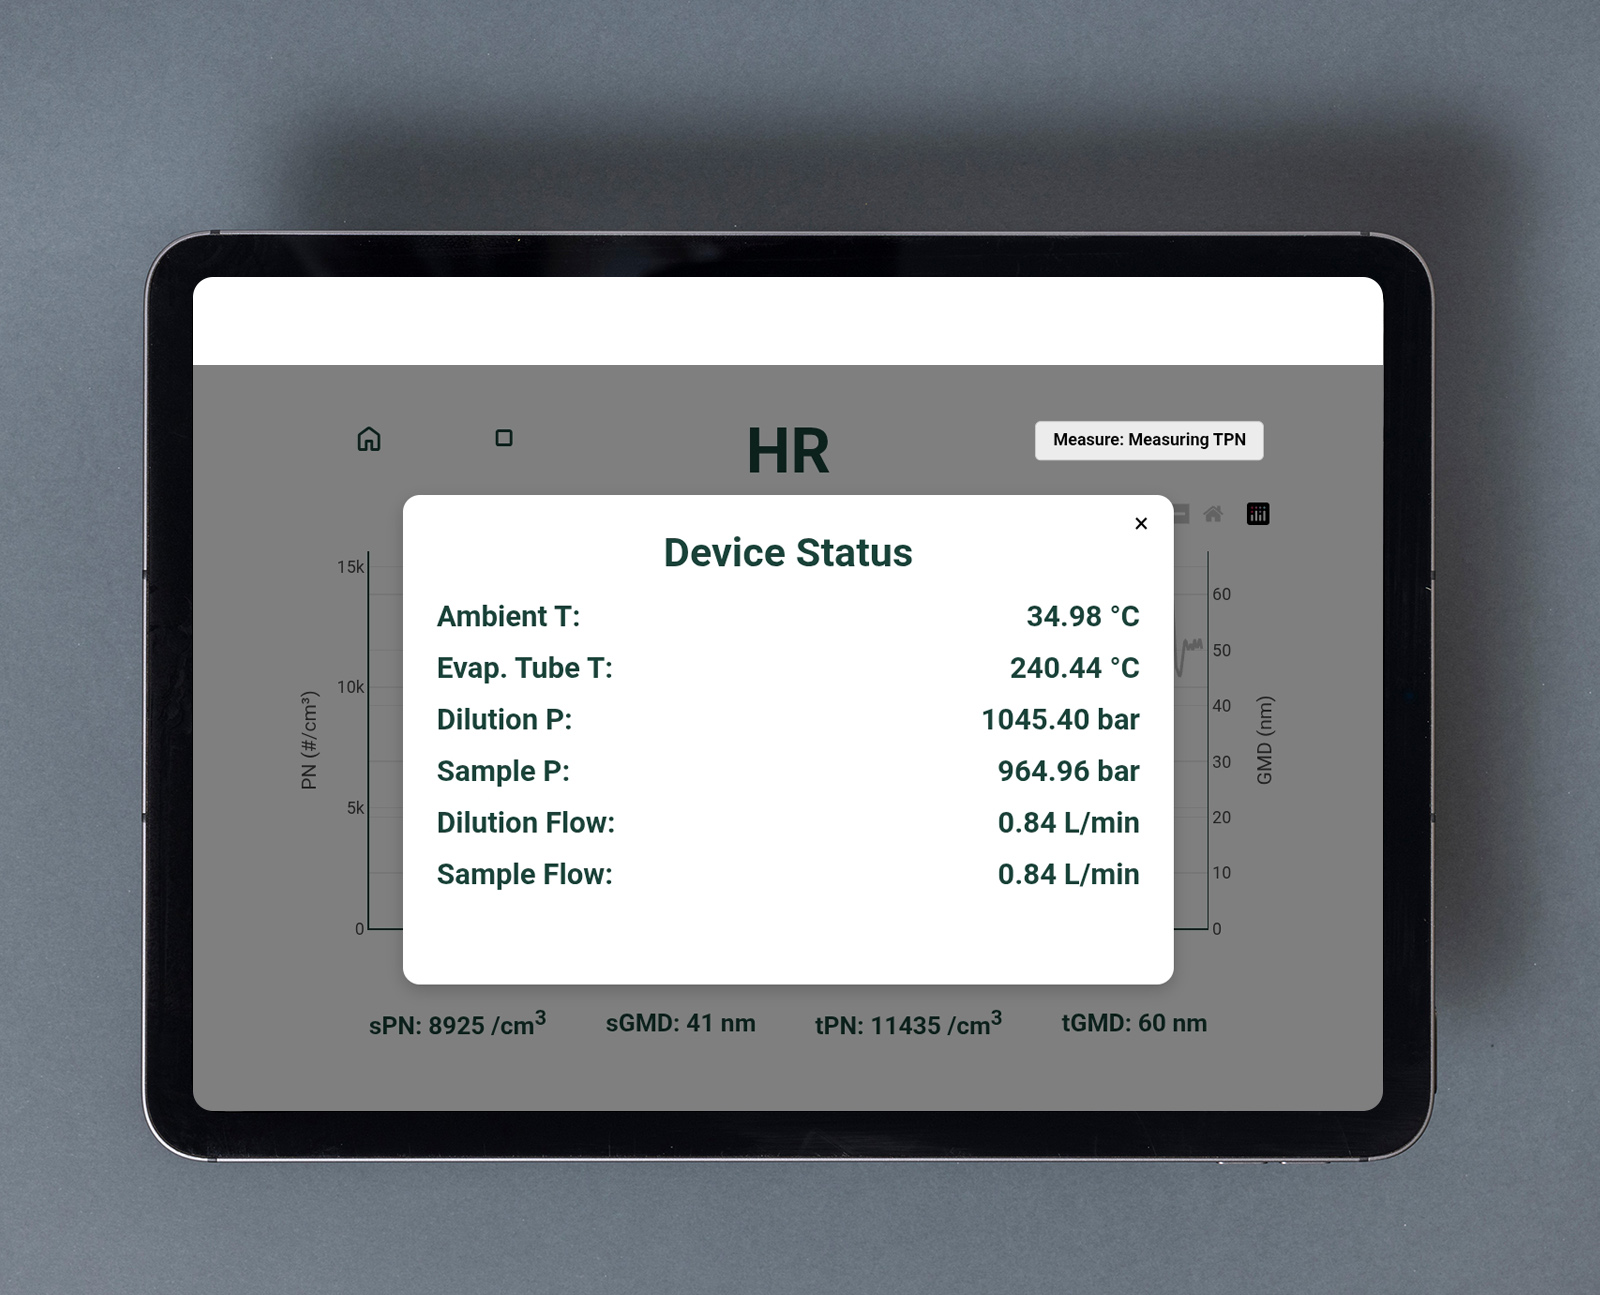
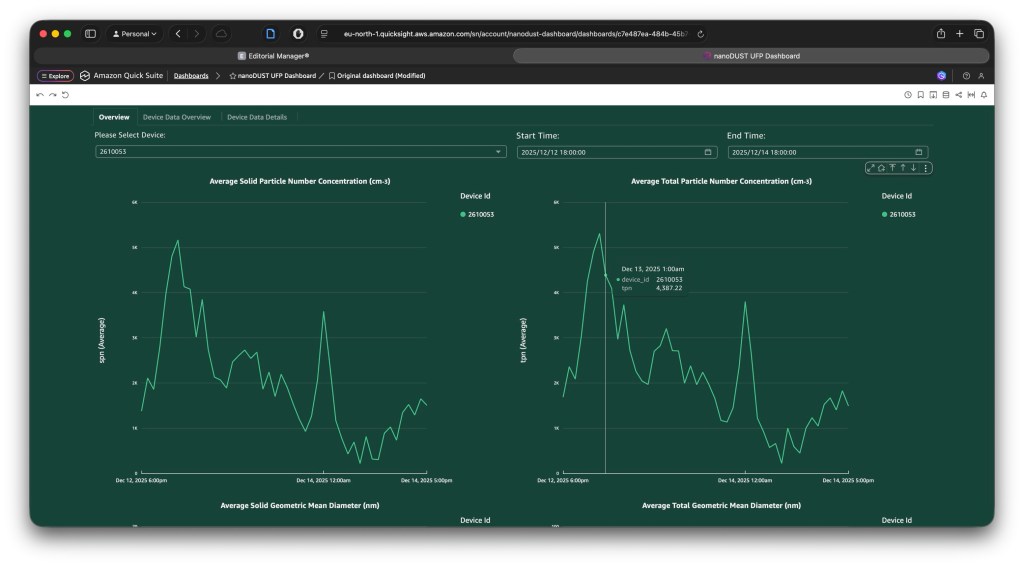
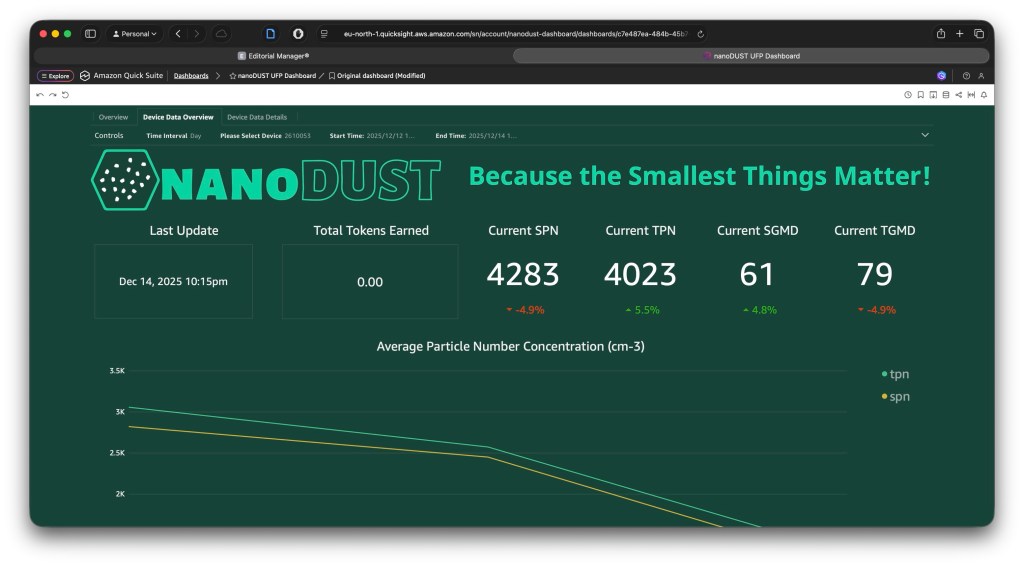
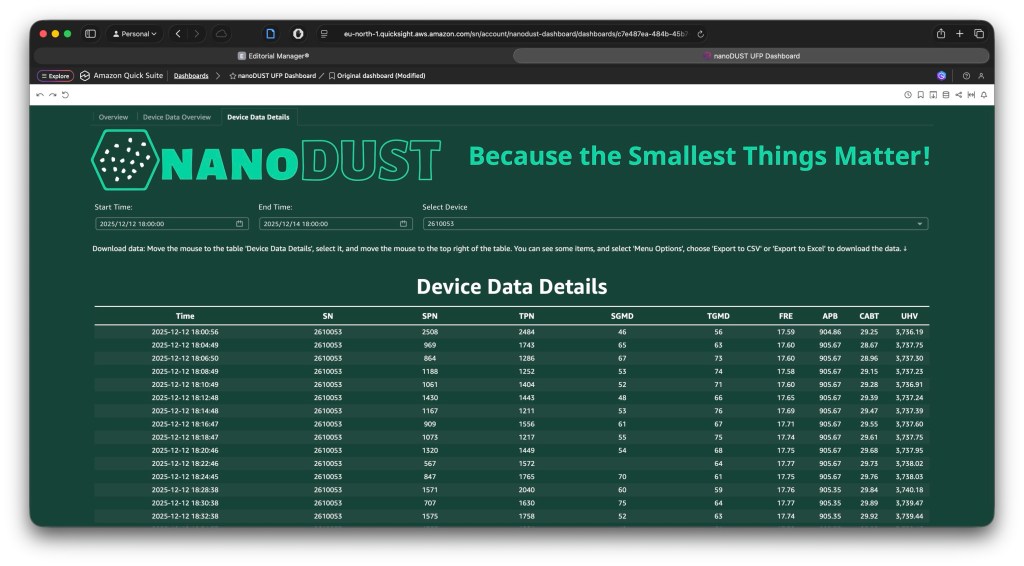
The Dashboard is where the nanoDUST AirPN10 truly shines. It offers three primary views: Overview, Device Data Overview, and Device Data Details.
- Remote Access: I found the LTE/Cloud connection much more efficient than the USB method. Being able to log in to a dashboard and see real-time data or generate a PDF report (see example) remotely is far superior to manually swapping USB sticks (which also risks the device’s weatherproofing).
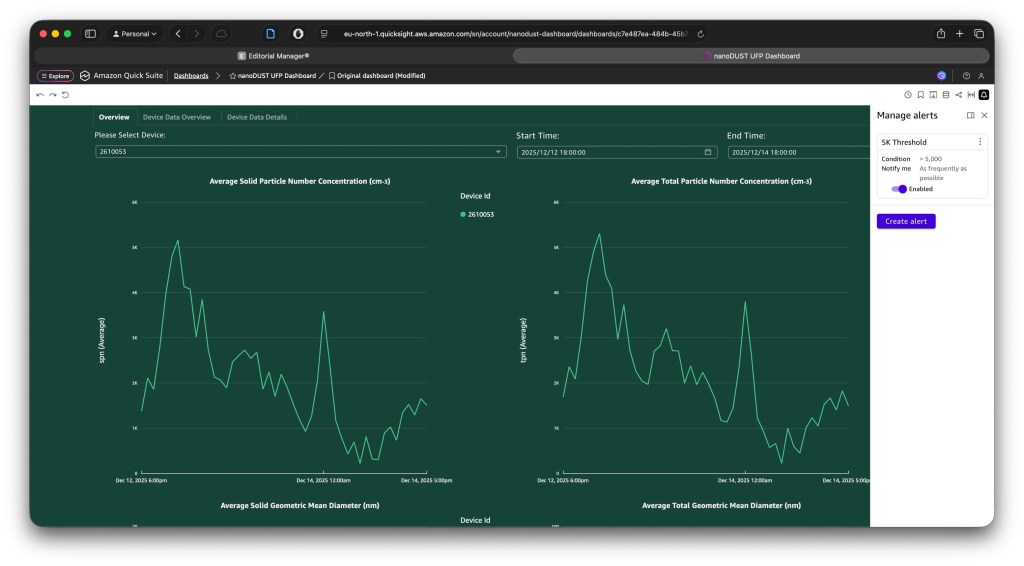
- Alerts: You can set automatic alerts based on your filtered data, ensuring you’re notified the moment a threshold (like the WHO 10,000 PNC limit) is crossed.
Final Verdict
The nanoDUST AirPN10 is a robust, fluid-free alternative to the cumbersome CPCs of the past. It bridges the gap between low-cost and high-end research station equipment. While I’d love to see a simple “Power On” LED and a more flexible tablet app, its accuracy and the power of its ADC technology make it a top-tier choice for anyone serious about measuring what truly matters in our air.
Discover more from See The Air
Subscribe to get the latest posts sent to your email.
