The Hidden Threat in Our Air: Why Measuring Indoor Ultrafine Particles (UFPs) Is a Modern Regulatory Maze

We have spent decades obsessing over PM2.5 —the fine particulate matter small enough to lodge itself in our lungs. We draft laws around it, track it on our phones, and buy home monitors to avoid it. But while our regulatory gaze has been fixed on particle mass, an invisible, almost weightless army of much smaller particles has been slipping through the cracks: Ultrafine Particles (UFPs).

Known technically as PNC0.1, these aerosols have an aerodynamic diameter of 100 nanometers or less. To put that in perspective, they represent a negligible fraction of total ambient mass, yet they often make up over 90% of the total particle number concentration (PNC) in our atmosphere. Because they are so unbelievably small, they don’t just settle in the lungs—they have the unique physical ability to cross into the bloodstream, posing distinct and severe health risks.

Yet, when we step inside our homes, we enter a measurement blind spot. In our current study across two Spanish cities—Granada and Almeria—we exposed a frustrating reality: meeting current PM2.5 standards provides a completely false sense of security when it comes to UFP exposure, and our current measurement tools and guidelines make it nearly impossible to tell if the air we breathe inside is actually safe.

The Non-Linear Disconnect

The most alarming takeaway from our research is that PM2.5 mass and UFP counts rarely talk to each other linearly.

In winter, Granada experiences a heavy “bowl effect” due to its surrounding mountains, trapping emissions from vehicle traffic and residential biomass-burning stoves. Outdoors, the 24-hour average UFP count spiked to a staggering 17,000 p/cm3—solidly shattering the World Health Organization’s (WHO) “High” threshold of 10,000 p/cm3.

However, look at what happened to the metrics side-by-side:

Environment (Outdoor)24h Avg. PM2.5​24h Avg. UFP CountWHO Status
Granada12.6 μg/m3~17,000 p/cm3PM2.5: Safe (Under 15 μg/m3 limit)

UFP: Exceeded High Threshold
Almeria5.7 μg/m3~7,800 p/cm3PM2.5: Safe

UFP: Exceeded Low Threshold by 7.8x

If your city council or home monitor only checks PM2.5 both environments look perfectly pristine. In reality, the air was teeming with an excessive concentration of ultrafine hazards.

This graph illustrates indoor air quality data in Almeria. The data tracks three specific parameters: PM2.5 (μg/m3), UFP Mean Size (nm), and Total UFP (PNC p/cm3). Each metric includes a temporal line graph on the left and a density curve on the right to illustrate the frequency of specific values.

The Complexity of Measuring UFPs Indoors

Why aren’t we tracking this inside our homes? Because measuring UFPs indoors is a logistical and economic nightmare for researchers and homeowners alike.

Traditionally, tracking these particles requires heavy, complex, and extraordinarily expensive laboratory equipment, such as Mobility Particle Size Spectrometers (MPSS) or Condensation Particle Counters (CPC). These instruments are not designed to sit quietly in someone’s living room for weeks at a time; they are loud, require constant maintenance, and cost thousands of dollars.

While newer, lower-cost “diffusion charging” sensors (like the nanoDUST AirPN10 used in our study) are bridging the gap by offering more practical, long-term stability, they still present some challenges. In our controlled testing, these portable sensors showed a strong correlation (R2 = 0.88) with reference instruments, but they consistently underestimated the total particle count, requiring correction factors to get an accurate reading.

For the average citizen, tracking the true quantity of particles in their indoor air is currently out of reach.

The Time Paradox

If the equipment hurdle wasn’t high enough, the guidelines create a massive loophole regarding timeframes.

The WHO’s “good practice statements” offer two benchmarks for high UFP exposure: a 24-hour mean (>10,000 p/cm3) and a 1-hour mean (>20,000 p/cm3). When we look at indoor environments, this dual-standard creates profound confusion.

Under Consideration

Indoor spaces are fundamentally dynamic. We don’t stand still in our houses for a perfectly uniform 24-hour cycle. We cook a meal (frying and toasting launch massive UFP peaks), we open a window, or we turn on a printer. At the same time measuring UPF indoors is quite challenging as the instruments are quite noisy and occupants complain about their operation after a while.

  • In our outdoor data for Granada, even though the overall 24-hour levels were high, there were multiple short windows in the 1-hour data where levels looked completely safe.
  • In Granada, we monitored an entirely unoccupied apartment with all windows and ventilation off for 48 hours. Even with zero human activity, the indoor air maintained a steady UFP average of 2,900 p/cm3—exceeding the WHO “Low” threshold simply because outdoor pollution slowly bled through the building’s envelope.
  • In Almeria, opening the windows for natural ventilation caused indoor UFP levels to instantly match the outdoors, averaging between 4,000 and 5,000 p/cm3.

The Path Forward: True Filtration

If natural ventilation simply invites outdoor traffic and biomass smoke inside, how do we protect ourselves?

Our study verified that mechanical HEPA filtration (Healthy Air 500 (HA500)) is one of the only reliably effective interventions we have. When we introduced a HEPA 13 purifier into the naturally ventilated Almeria home, the results were swift: 1-hour UFP concentrations plummeted from 5,000 p/cm3 down to a baseline of roughly 700 p/cm3, shifting the indoor environment into the strict WHO safety targets. Interestingly, it also altered the aerosol profile, dropping the average indoor particle size from 40 nm to a microscopic 16 nm by successfully capturing the larger fractions.

Ultimately, the World Health Organization should move away from ambiguous “good practice statements” and institute definitive, clear indoor UFP tracking protocols. We must stop treating PM2.5 compliance as a clean bill of health. Total safety cannot be measured in mass alone; we have to start counting the particles that are small enough to slip into our veins.

What are your thoughts on this? Do you track the air quality in your home using a mass-based monitor, or have you already transitioned to looking at particle numbers? Let’s discuss in the comments below!

Field Review: nanoDUST AirPN10 — The Next Generation of Nanoparticle Monitoring

The landscape of air quality monitoring is shifting. For years, the focus remained on PM2.5 and PM10 (mass concentration), but we are increasingly realizing that the most dangerous threats are the ones we can’t weigh. Ultrafine particles (UFPs), or nanoparticles, are so small they penetrate deep into the bloodstream, yet they often escape traditional sensors and regulatory implementations.

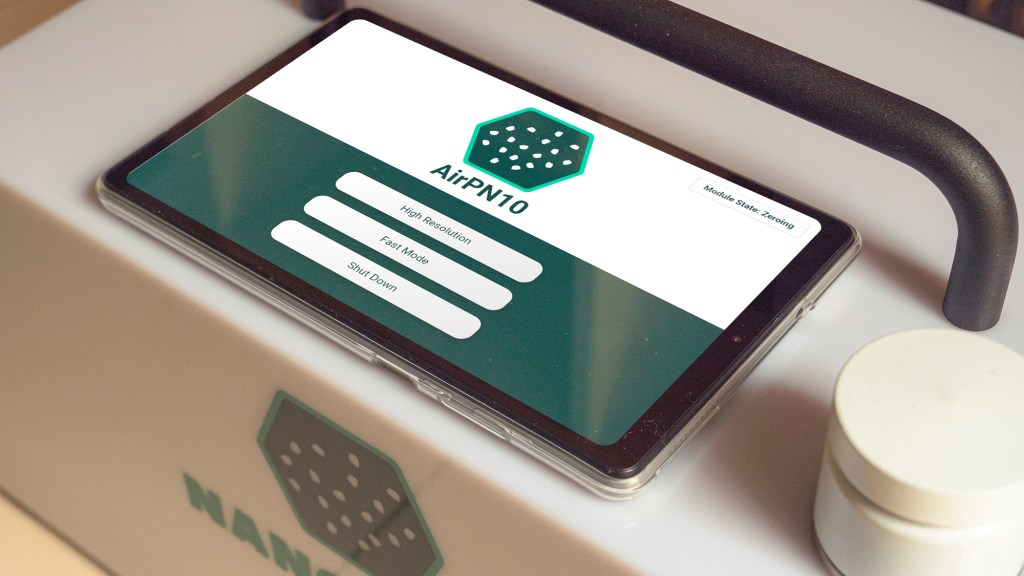
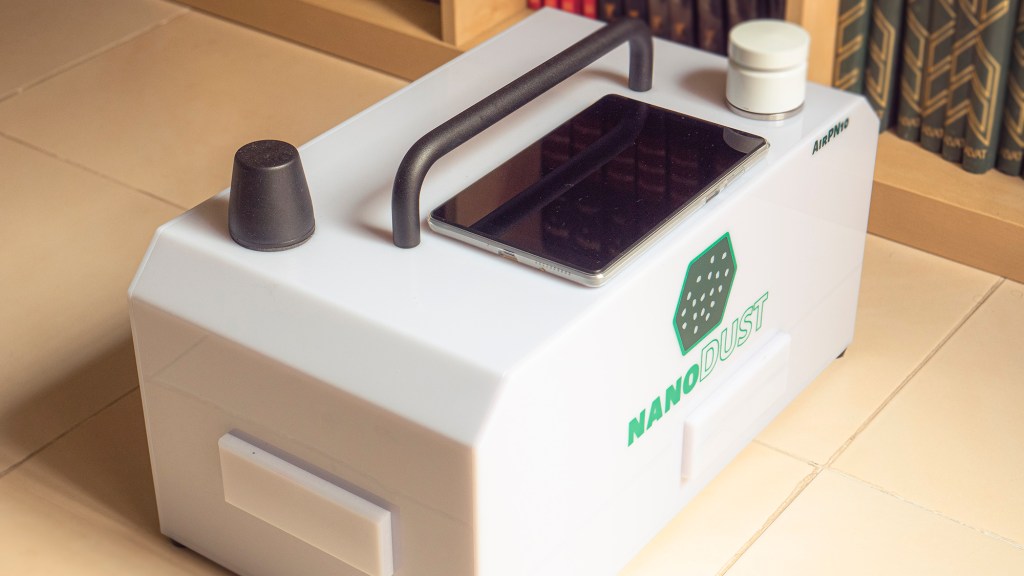
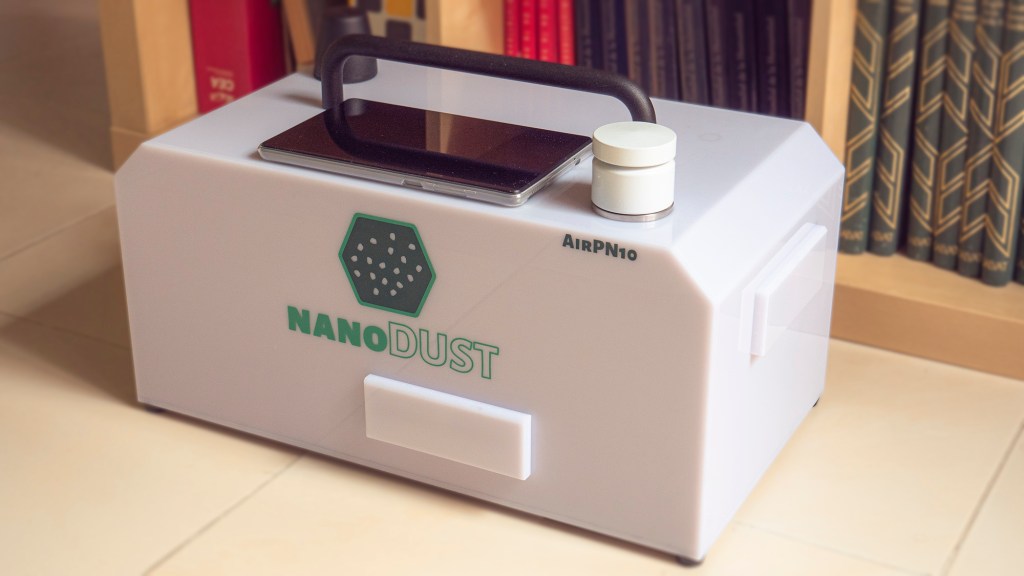
Enter the nanoDUST AirPN10. Designed as a “Plug & Play” solution for monitoring these invisible threats, it promises to bring lab-grade accuracy to the field without the logistical headaches of traditional counters.

Technical Specifications

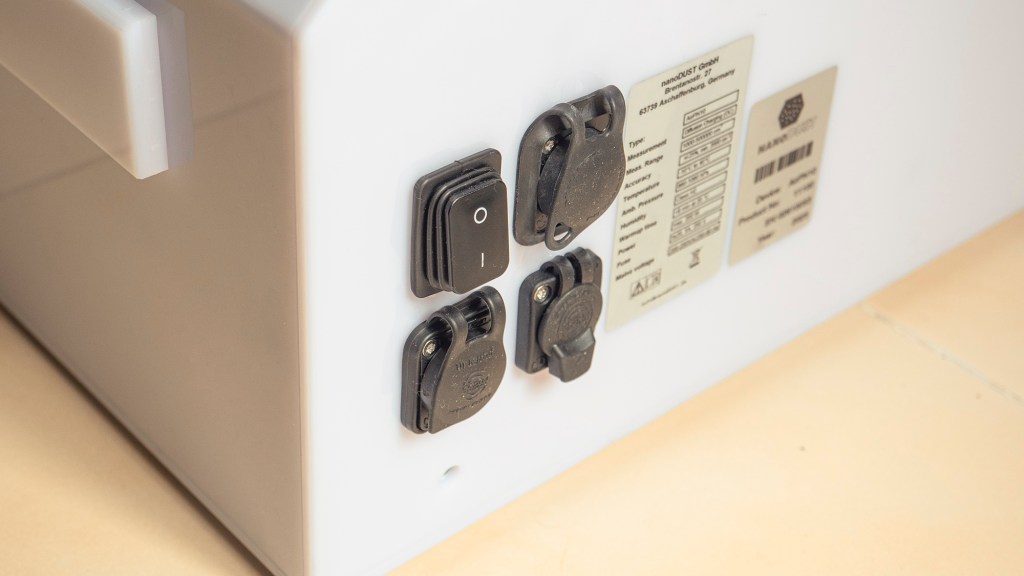
The nanoDUST AirPN10 is built for high-precision air monitoring. Its standout feature is its independence from working fluids, unlike Condensation Particle Counters (CPC) that require constant refills of butanol or water.

  • Measurement Range: 1,000 to 500,000 particles/cm³
  • Lower Detection Limit: D50 at 10 nm
  • Technology: Advanced Diffusion Charging (ADC)
  • Aerosol Handling: Integrated Aerosol Switching Technology (AST) for solid vs. volatile separation.
  • Weight: ∼9 kg
  • Connectivity: LTE (Cloud), LAN (Ethernet), and USB.
  • Durability: Weatherproofed for outdoor use (when not using the rear USB port).
  • Power Consumption: Typically <100 W
  • Ingress Protection: IP55 Weatherproof
  • Sample Inlet: PM10 Sampling Head
  • Calibration Aerosol: Soot
Read More »

Interview – Airport Series: #1 The Growing Concerns of Van Nuys Airport and Its Impact on Local Community

I recently learn from Sue, a resident of Los Angeles, who is living in the shadow of the Van Nuys Airport (VNY) that the air quality of the area and mental health of the residents have been affected dramatically. She shared with me the growing concerns regarding the environmental and health impacts of the airport’s operations, particularly due to the increasing number of private and charter jets.

According to Sue over the past few years, the VNY has essentially transformed into a commercial airport due to the influx of private and charter jets. This brings with it an incessant noise pollution problem, as there’s no curfew and flights come in all day and night. And, they are under the most congested airspace in the world, with five airports in the LA area, all converging over them.

Although the airport has been around since the 1920s the changes, in recent years are drastic. Sue lives in that area since mid 80’s. They are now literally feet away from dozens of jets that emit toxic fumes into their homes, schools, and lungs. It was not like this up until a few years ago.

Read More »