No, this is not the case for the air quality industry, but quite the opposite.
Since the outbreak of the pandemic, the media has covered the topic quite extensively. Big newspapers like The Guardian, The Sun, NY Times, etc have written at least a few articles about how good is the air outside and small local newspapers, which had never mentioned any environmental issue before, wrote about the same subject.
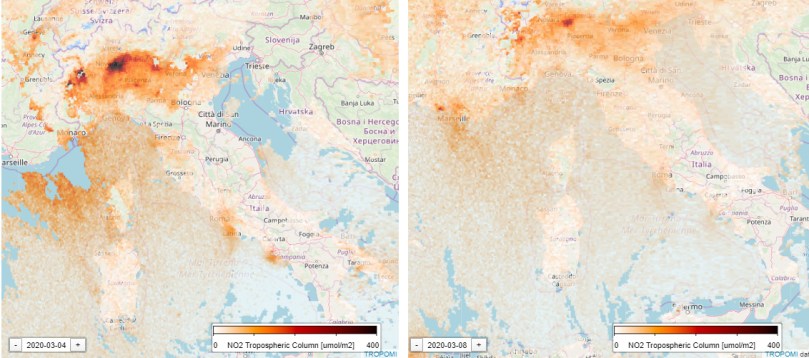
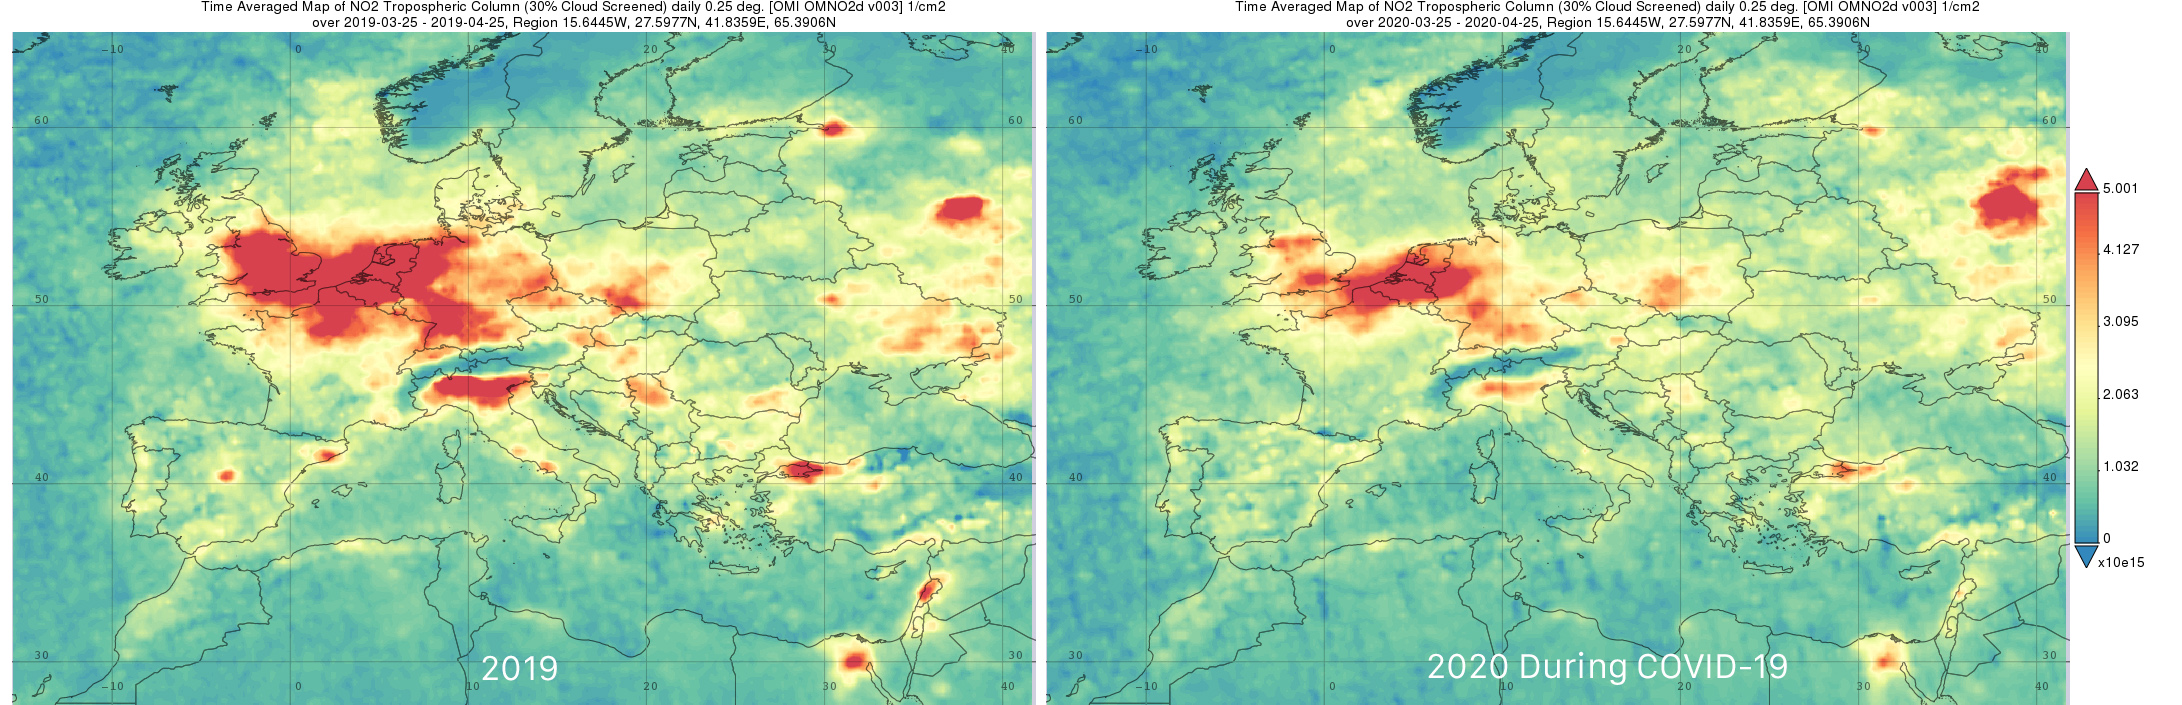
The pandemic has shocked people to their core, as a result, during the lockdown, more people became aware of the issue of air pollution and how traffic contributes a lot to the problem. In a recent NASA seminar, I learned that the satellite maps that we all have seen in newspapers presenting the NO2 concentrations before and during the lockdown, don’t represent the NO2 on the surface, where people breathe. However, they represent the total amount of NO2 from the surface to the top of the troposphere.

Indoors
Of course air pollution is not only present in the streets but inside our houses too, as a result, people have taken closer attention to indoor air quality as they spend 24/7 inside their houses, working, cooking, eating, relaxing, and playing with their kids.
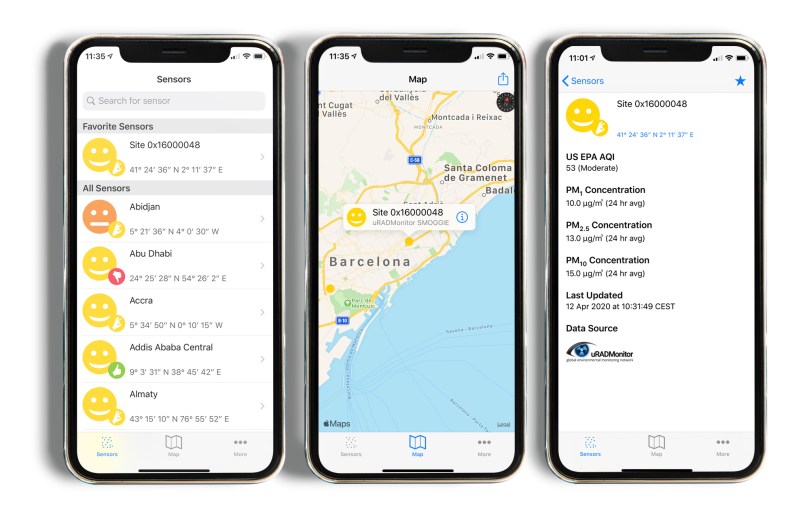
Being all day long inside your house makes you think about how you can improve the indoor conditions and of course, air quality is as important as a pillow for your head during a night’s sleep. You want to be in a comfortable environment with the right temperature, humidity, and air quality.
This is the reason many companies sold out indoor air quality monitors. I had people asking me where they could find an air quality monitor and some companies telling me “we are out of stock” or they were running to fulfill orders.
Let’s see what AQ data from Airthings say before and during the lockdown. Immediately, we can understand that there was an average increase in CO2 concentration inside houses. Nevertheless, there are some factor we have to consider:
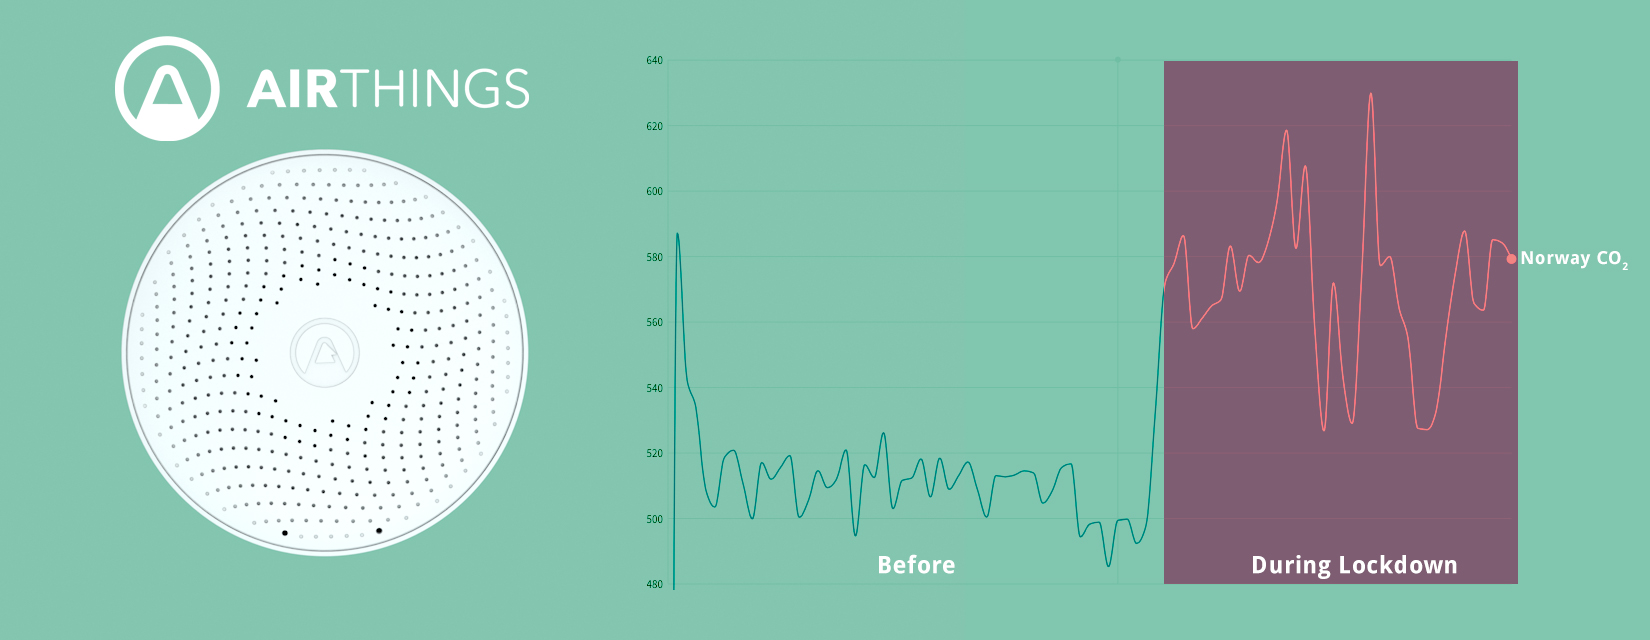
First of all, Airthings’ users are conscious about the air they breathe because the devices help them see the air quality so they may take measurements against high CO2 concentrations. Imagine what happens to houses were no monitors can be found. Secondly, we have to consider that houses in northern Europe tend to have HRV systems and fresh air is introduced automatically to the indoor environment.
All in all, not all houses, have mechanical ventilation systems and during winter, when windows are closed, CO2 levels tend to be above 1000ppm for a great period during the day. Before COVID-19, houses used to “breathe” when homeowners went to work or school but not anymore, so monitoring the air quality indoors is more crucial than ever before. Especially if we want to avoid Brain fog, which is the inability to have a sharp memory due to high CO2 concentrations.
Outdoors
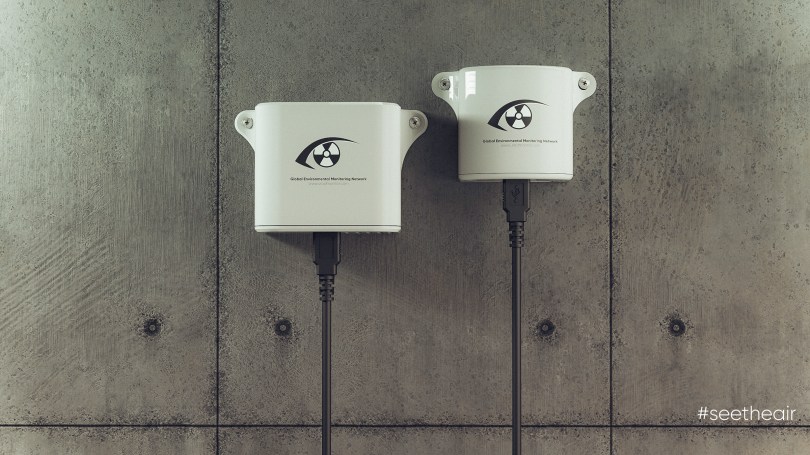
On the other hand, outdoor air was and still is important because one day we will return to a “new normal life” where we will need to breathe clean air outdoors. Cities are preparing the streets for the post-pandemic era, we have seen examples of cities allocating more space to the pedestrians and cyclists but also there are cities that now are investing in IoT low-cost outdoor air quality stations that can easily be placed all over the cities and provide us with a more dense spatial air quality coverage.
The improved and dense spatial air quality coverage will allow the policymakers to make better decisions and will allow citizens to have access to air quality data more easily than before as the outdated air quality stations we can currently find in many cities sometimes require manual work to register values one by one and they are not data-driven. This manual work makes data not real-time, hard to reach, and unsuitable for instant decisions. For example, in Andalucia, Spain the PM2.5 measurements are available after a month from the day the data were taken, and then you need to file an official form in order to access them.
Liberating accurate information and allowing people to access it, I think will transform the way we think and act, two important words that are key in order to address the issue.