Formaldehyde CH2O is a very dangerous chemical-gas that can be easily found inside a house because it off-gases from paints, carpets, furniture, etc… In this article I am going to find out how well a cheap, handheld air quality monitor WP6930S compares to a more professional solution such as the uRAD A3.
Elon Musk needs money for his projects, so he decided to sell a flamethrower and apparently everyone is so exited about this useless device. A huge hype for a device that doesn’t complete any purpose.
Of course, my real worries aren’t whether the flamethrower has a purpose or not but what consequences will have to the environment. A device which throws flames everywhere and is capable to destroy forests, houses and burn habitats. More importantly, we suppose to fight against global warming and yet we create more devices which burn oxygen and generate carbon dioxide CO2 and air pollution.
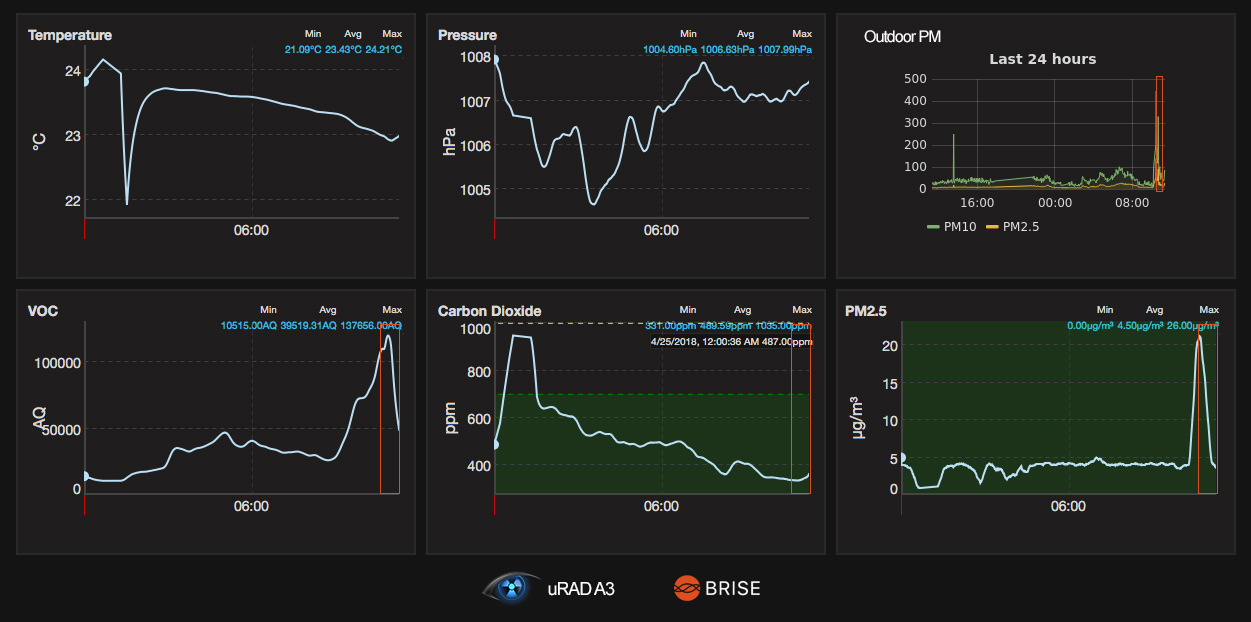
On the previous article, I presented a new air purifier with an A.I. Engine called BRISE C200. In general, the best way to prove the efficiency of an air purifier is by taking measurements with a respectable 3rd party AQ monitor while there is an air quality issue ongoing inside the room and that is what I did. I used the uRAd A3 Monitor for the measurements and the device was placed near the purifier.
At first, I had set the purifier off on purpose because I didn’t want the A.I. engine to kick in automatically before I was able to register the event. When a PM2.5 spike was registered, as you can see on the picture below from 4μg/m3 to 26μg/m3, I turned on the purifier and the air quality inside the room immediately improved till it returned to the normal PM2.5 concentration and the purifier turned itself off automatically.
In the picture below you can see the FC200 4-in-1 Combo filter after one month of usage. The carbon pre-filter has captured PM10 particles, hair, dust and even a little dead spider, which was caught by the purifier’s air flow when it was set on Turbo Mode. After that, we can see the blue anti-bacteria filter and under it the HEPA filter responsable for capturing all PM2.5 particles. Finally, the TiO2 will absorb harmful chemical vapors.
I wanted to repeat the experiment with the BRISE C200 purifier and a different AQ Monitor in a different room and day, so with the help of the AirVisual AQM I set them up in my bedroom. This time it took 14 min into Turbo Mode to clean the air, the bedroom is a bit bigger. When the purifier achieved a concentration of ±1μg/m3, I turned it off and with the door closed the air inside the room was kept clean, but immediately after I opened the door the air quality was decreased. Below you can see the results.
It was time to review an air purifier because it is a vital device for those who suffer from air pollution and allergies. The purifier that I am going to review is called BRISE C200. It was first launched in Taiwan in 2017, although the company’s headquarter is in the Netherlands with team members in Germany and Taiwan. I have been following this company since their first steps into the air quality market.
The reason I wanted to review this purifier first is because it is the first air purifier with artificial intelligence aka A.I. and because it combines two devices in one, an air quality monitor and a purifier, obviously.Read More »
It is well known that exposure to high levels of air pollutants raises the risk of physical illnesses such as respiratory infections, lung cancer, heart disease, stroke, dementia and Alzheimer. However, there are new studies suggesting that air pollution is responsible for mental illnesses too.
Back in 1970 Lead Pb(from the Latin plumbum) was used to be added in the petrol fossil fuel, as a result, itwas later associated for contributing to behavioral problems, learning difficulties and lowered IQ among children.
In recent years, Sulphur Dioxide SO2, has been associated with a high risk of hospital admissions for mental disorders in Shanghai.Read More »
Many times I have mentioned that a simple VOC sensor isn’t enough to determinate if the air quality is good or not especially in interior environments. Formaldehyde CH2O is a VOC and since I have an AQ monitor uRAD A3 that features both a Formaldehyde sensor and a VOC sensor I will try to find out if there is a correlation between them.
I have been monitoring my house for Formaldehyde for over a month now by leaving the AQM on including while I was out on a trip for 4 days and during that time the house was well closed. This kind of experiment allowed me to determinate if my furniture, paint, etc outgassing Formaldehyde.Read More »
Who says that everything is made in China or USA? Well, let me introduce you the uRAD Monitor A3 an Air Quality Monitor which is made in Romania, Europe since 2012. The design, firmware design, server software and big data database maintenance and development are all made there and amazingly enough even the unit that I have on my hands is made personally by the CEO Radu Motisan. As a result I am very proud to review it and talk about the cons and pros.
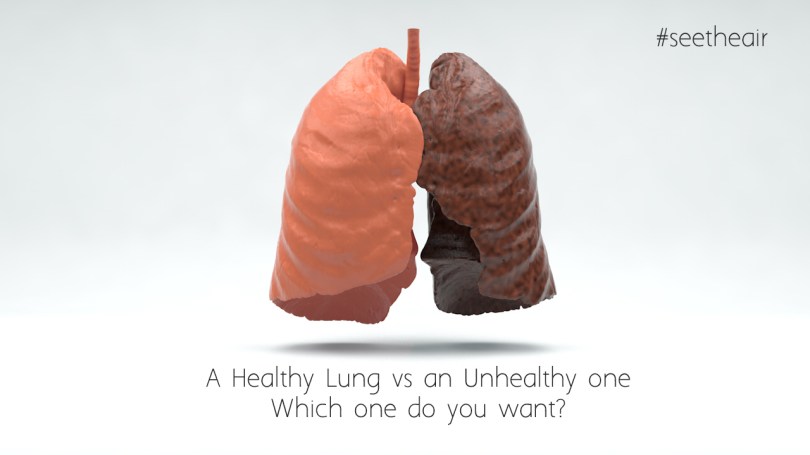
I can guess with high accuracy that your answer to the question of the image above is the Healthy Lung. If I guessed right, which I did, then I will advise you to be careful about what you breathe.
These are some gases that chemically poison the body’s oxygen transport systems, preventing oxygen from reaching the body tissues like the Carbon Monoxide CO, which combines with haemoglobin and blocks its ability to carry oxygen around the body, but there are some other gases that cause asphyxiation by producing severe irritation in the air passages and lungs like the Nitrogen Dioxide NO2.
NO2 dissolves in the moisture on any moist tissue surfaces, and forms strong acids or alkalis which then burn the delicate tissues. Health effects are related to its ability to dissolve in moisture to produce Nitric Acid which is a strong mineral acid.Read More »
Throughout time researchers have been trying to monitor air pollution and create urban pollution maps as precise as possible. This isn’t an easy task for a couple of reasons. Firstly, a lot of sensors are needed to be spread all around the city and then the researchers have to decide if the sensors will be stationary or will be mobile. Some clever and interesting projects to combat the air pollution with mobile Air Quality Monitors (AQMs) are.
The Pigeon Air Patrol
A creative way for mobile Air Quality Monitors to be spread around the city. The pigeons wear a small device with O3, VOC and NO2 sensors. While they are flying around the city or sitting on a traffic light to rest, the sensors are constantly logging air quality data. The data will be later analysed by the researchers when the pigeons return to the base. This air monitoring campaign run for 3 days only and the pigeons are now back to their normal life.
This innovate idea for monitoring urban air quality was made by James Puderer. The idea is to place Air Quality Monitors on top and inside the Taxis/Cabs sign and allow them to do their normal and daily trips around the city while they are logging air quality data. Basically it is an Android Things based data logger with a host of environmental sensors, GPS, and battery. In this project he uses temperature, humidity, pressure, and air-borne particulate PM10 – PM2.5 sensors.
We all know how busy school roads can be, especially during peak hours when parents leave and pick up their kids from schools. Definitely the air quality is very bad during that time. Some universities, colleges and organizations have decided to track the air pollution from a different perspective by giving special backpack to some of the students, backpacks with a GPS and air quality sensors. Students are responsable to carry the backpack AQM with them and monitor the air quality. Later the experts will analyze the data that the students had logged on their backpack AQM.
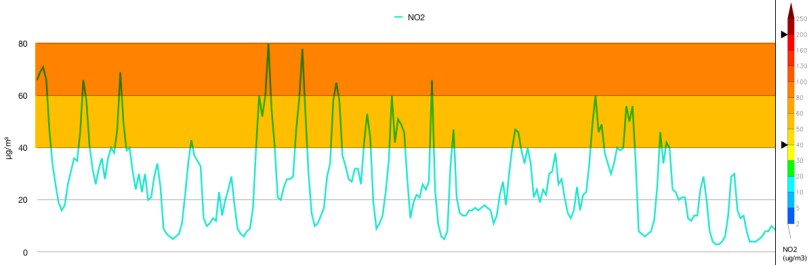
It hasn’t been a long time since one of the AQ monitors that I have, the uHoo, activated the NO2 sensor and helped me realize that the air quality isn’t so good regarding the levels of Nitrogen Oxide inside my house. I had to do some research and find out if the sensor was right and where this NO2 comes from.
Mainly, NO2 is produced by road traffic and energy production like power plants, with that in mind I began investigating. It wasn’t an easy possess, I had to consider many factors.
Firstly, I thought the source of this particular pollutant NO2 was the neighbors’ cars as early in the morning they will all go to work and some of them they will turn the engines on and they will wait till the engines are warmed up enough to set off. The buildings in my neighborhood create a U and cars are parked inside that U where the NO2 could be trapped temporally until it enters inside the houses, through the windows or escapes. Partly, I was right some spikes of NO2 were registered by the sensor at this time of the day. Source #1 was found but unfortunately the NO2 wasn’t high only at that time of the day, so I had to search further.
Buildings forming a U
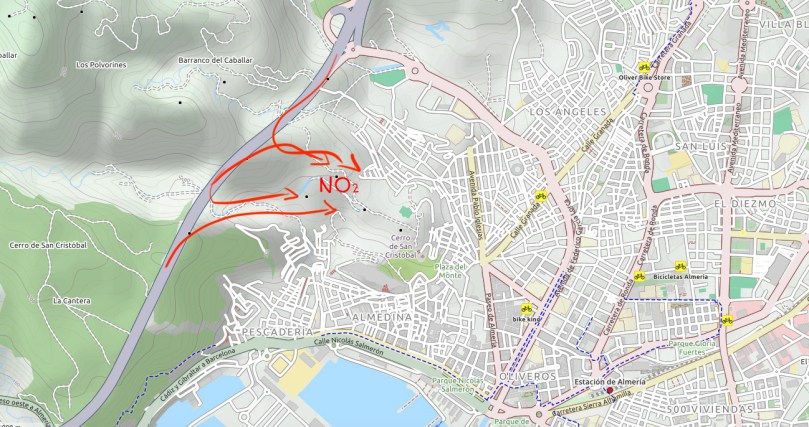
Next, I analyzed the topography of my area. I had to find all the possible sources because I wanted to understand it as good as possible. A highway is very close to my neighborhood, about 650m but we are separated by a natural hill. I am not able to hear any road noise but I guess some pollution finds its way here depending the weather and wind conditions. Source #2
Highway A7
Then I had to see the greatest picture and with some further examination I was able to find all the factories / power plants in my region. There are quite many as you can see on the map below. My city Almeria doesn’t have as many factories as Sevilla for example but here is produced a enormous quantity of vegetables and fruit as a result the transportation is quite active. Source #3
Industries across Andalusia
Finally, the winds can bring a great amount of NO2 from as far as 300km away. As you can see from the animated GIF below, in Gibraltar were many boats enter into the Mediterranean sea a huge concentration of NO2 is created there. Source #4
Conclusion
By starting super locally inside my bedroom I was able to zoom out and see the whole picture of the air pollution and how it expands. It is amazing how the pollution can travel long distances and reach our lungs. This is the reason we have to raise awareness globally. Regarding the sensor, although the NO2 values that the sensor took weren’t very precise, due to the lack of calibration, the device was able to detect the fluctuations of the pollutant and alert me. This is a domestic or an office device and I think the results are expected because you can’t compare it with a laboratory instrument that cost thousands of dollars. The importance here is the value that the device will bring to the user, and it is substantial.