Zooming out – NO2 Pollution

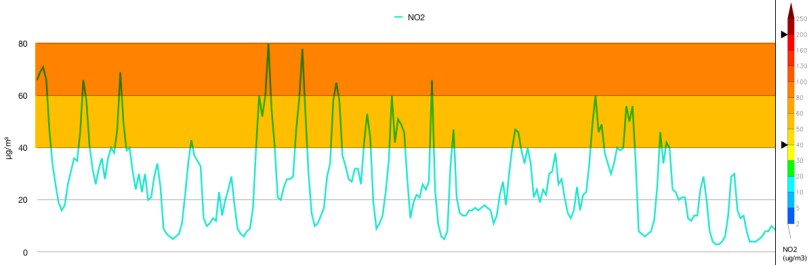
It hasn’t been a long time since one of the AQ monitors that I have, the uHoo, activated the NO2 sensor and helped me realize that the air quality isn’t so good regarding the levels of Nitrogen Oxide inside my house. I had to do some research and find out if the sensor was right and where this NO2 comes from.

Mainly, NO2 is produced by road traffic and energy production like power plants, with that in mind I began investigating. It wasn’t an easy possess, I had to consider many factors.

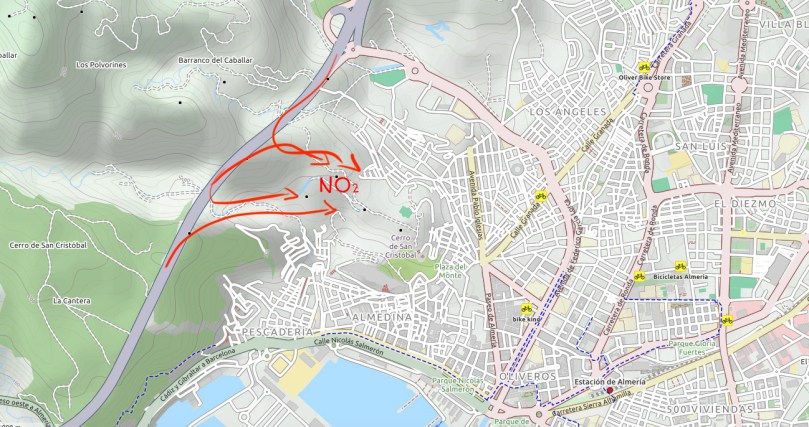
Firstly, I thought the source of this particular pollutant NO2 was the neighbors’ cars as early in the morning they will all go to work and some of them they will turn the engines on and they will wait till the engines are warmed up enough to set off. The buildings in my neighborhood create a U and cars are parked inside that U where the NO2 could be trapped temporally until it enters inside the houses, through the windows or escapes. Partly, I was right some spikes of NO2 were registered by the sensor at this time of the day. Source #1 was found but unfortunately the NO2 wasn’t high only at that time of the day, so I had to search further.

Screen Shot 2017-11-12 at 16.29.45
Buildings forming a U

Next, I analyzed the topography of my area. I had to find all the possible sources because I wanted to understand it as good as possible. A highway is very close to my neighborhood, about 650m but we are separated by a natural hill. I am not able to hear any road noise but I guess some pollution finds its way here depending the weather and wind conditions. Source #2


Screen Shot street no2
Highway A7

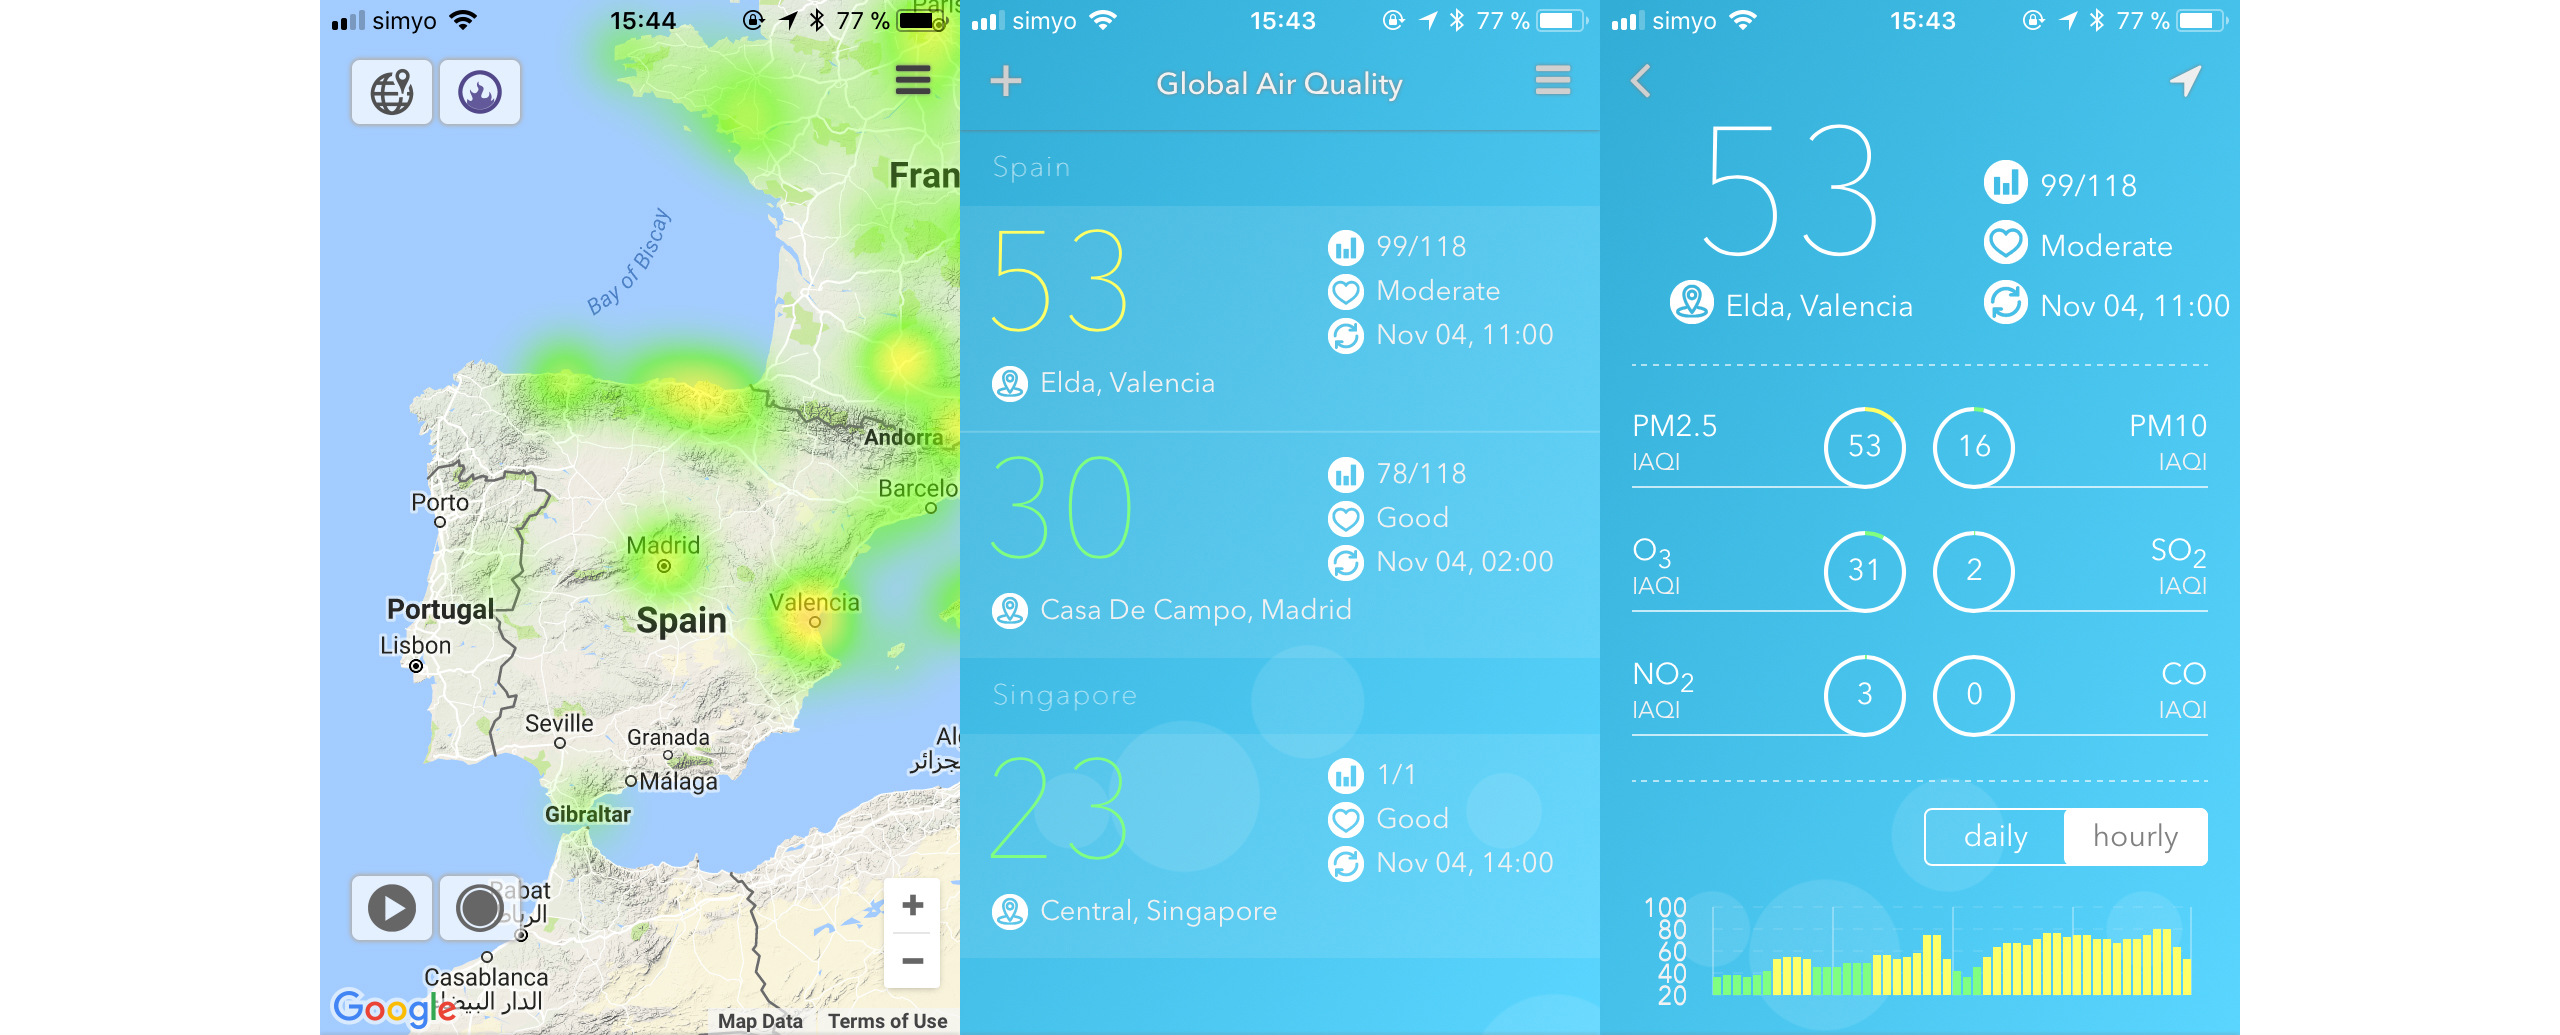
Then I had to see the greatest picture and with some further examination I was able to find all the factories / power plants in my region. There are quite many as you can see on the map below. My city Almeria doesn’t have as many factories as Sevilla for example but here is produced a enormous quantity of vegetables and fruit as a result the transportation is quite active. Source #3

Screen Shot 2017-11-12 at 12.04.16
Industries across Andalusia

Finally, the winds can bring a great amount of NO2 from as far as 300km away. As you can see from the animated GIF below, in Gibraltar were many boats enter into the Mediterranean sea a huge concentration of NO2 is created there. Source #4

BSC-ES_FORECAST_NOx_ANIM

no2 graph

Conclusion

By starting super locally inside my bedroom I was able to zoom out and see the whole picture of the air pollution and how it expands. It is amazing how the pollution can travel long distances and reach our lungs. This is the reason we have to raise awareness globally. Regarding the sensor, although the NO2 values that the sensor took weren’t very precise, due to the lack of calibration, the device was able to detect the fluctuations of the pollutant and alert me. This is a domestic or an office device and I think the results are expected because you can’t compare it with a laboratory instrument that cost thousands of dollars. The importance here is the value that the device will bring to the user, and it is substantial.

17 Air Quality Apps

Not everybody can afford an AQ Monitor or simply not everybody wants to spend money on a AQ Monitor. That’s fine because here are 17 Free/Paid apps for you to check the outdoor air quality in your area. Some of them can notify you when the Air Quality is poor and guide you on breathing cleaner air. Unfortunately some apps don’t support some regions, this is because some developers face difficulties to obtain data from local authorities. (The public air quality stations in my region suck!)

CALIOPE (Free) ♥♥♥

caliope

Caliope is an air quality forecast system for Spain, developed at Earth Sciences Department of the Barcelona Supercomputing Center – National Supercomputing Center (BSC-CNS). The app supports all Spanish regions and the website version supports most European countries. Available data O3, NO2, SO2, PM10 and PM2.5. Maps and Pollutants. The website is available in English and Spanish.

EPA AIRNow (Free) ♥

EPA

The EPA AIRNow was designed by the United States Environmental Protection Agency. Although the agency has access to all the US AQ stations and a huge amount of data, the app is plain and with a very poor design. There is nothing special about this app. Even the icons are pixelated. They should be ashamed, the app looks like an internet page from 1999.

AirVisual (Free) ♥♥♥♥♥

airvisual

AirVisual provides a free app for their device Node/Pro but it also works without it.  You can have access on a huge amount of outdoor AQ Stations around the globe. With a history browsing for all the pollutants, maps, ranking and news. The data are from public stations but also from their devices around the globe.

Wunderground (ads) ♥♥♥♥

Wunderground

Wunderground is basically an advance weather forecast app but they also provide air pollution data if you are lucky enough, which means depending the weather station they use to get the data for your area. If the weather station in your area has air quality sensors then they will provide you with the data.

Plume (Free) ♥♥♥♥

plume

Plume Labs has design this app to help people avoid air pollution. Their app offers an air pollution forecast. It is a simple but a complete app. You will see an Air Index at the home screen, weather conditions and the activities that they recommend you to do depending the air quality at that time. They use public AQ stations but they will also combine the data from their devices in the near future. It supports notifications.

CleanSpace (Free) ♥♥♥

cleanspace

CleanSpace focuses on Carbon Monoxide air pollution. On the home screen you can see the “current” air pollution from your device but if you don’t have a device you can also browser their air pollution map. They also provide some weather data from the local weather station. A bit limited on the pollutants.

Air Quality (Free) ♥♥♥♥

Air Quality

The app exist on the app store with 2 different icons but the same name, by the same developer and the same interface. It is a very nice app with plenty of data. The app has some nice animations and a clean design.

Airpocalypse (Free) ♥♥

Airpocalypse

This app is for the Chinese citizens because only supports Chinese cities. Super Clean design and some funny icons and quotes.

BreezoMeter (Free) ♥♥♥

BreezoMeter

BreezoMeter will help you get to the point of the air quality immediately. They support a map but the elephant will let you know if your outdoor air quality is safe and it will give you some advice. It will also tell you which is the dominant pollutant in your area.

Netatmo (Free) ♥♥

Netatmo

Netatmo is mainly a weather forecast app but it also provides some simple air quality data. Nothing fancy regarding the air data.

Air Bubbles (Free) ♥♥

AirBubbles

The Air Bubbles app indicates the air quality with colour-coded bubbles. Not many info available.

Air Matters (ads) ♥♥♥♥♥

air matters

Air Matters provides air pollution data, weather data and allergy data. If you suffer from allergies from a specific tree or plant like mugwort or olive trees etc, it will provide you with all the useful data. History browsing is also available and maps. Very clean and good design.

Awair (Free) ♥♥

awair

Awair has a small and basic tab with the outdoor air quality and weather conditions which allows you to compare them with the indoor air quality in case you  have their device.

Air Checker (ads) ♥

Air Checker

Air Checker is very simple, you just type your city and it tells you the air quality plus the pollutants. I compared the data with others and they didn’t correlate at all. So I am not very sure about the accuracy.

Aerium (Paid) ♥♥♥

aerium

Aerium is a weather forecast app but if you upgrade the free app it will also give you air quality info.

Kaiterra (Free) ♥♥♥

Kaiterra

Kaiterra is a free app for the Laser Egg 2 but it also provides outdoor air quality data. Simple design with an AQI and a histogram for the air pollutants.

Foobot (Free) ♥


foobot

Foobot has a basic tab with the outdoor air quality index for the outdoor location of the indoor device.

Air Quality Monitors – Comparison 2017 Q4

Holidays are coming and people are searching for gifts or for ways to protect themselves from air pollution. A great way to start 2018 is by seeing the air around you. Once more new companies offer more choices to the costumers and the old ones offer mature products through solid updates. On this update I have removed the Design row and I have added the Application Programming Interface API row, for those who want to know if the companies support this feature. Click on the image and download the PDF document.

comparison air 2017 Q4


  • Prices may vary during time.
  • Some Companies don’t specify on their data sheet if their devices are capable to measure PM2.5 or PM10 and they just mention the word dust.
  • Some other companies say: Our product goes beyond CO₂ by analyzing substances that directly affect your well-being by measuring VOCs. They aren’t clear if their devices have CO₂ sensor.
  • Some of the devices are AQI Monitors and Air Purifiers Combo. On this list you can only read the features as an AQI monitor.

Wildfires and Air Pollution

The last few months and due to the lack of rain and the climate change some places in the world are facing extreme wildfires, most of the times manmade. Places like Galicia-Spain, Portugal and California-USA have been facing a great danger. The wildlife has been left without its habitat and humans without clean air. Unfortunately this kind of distraction creates enormous quantities of air pollution. A lot of times the air pollution spreads downwind from the fire source and even reaches other countries, so-called Cross Border pollution.

What kind of pollutants do the wildfires produce?

Mainly wood smoke contains a mixture of PM2.5, PM10 particles and various gases. More precisely wildfire smoke is a mixture of carbon dioxide, carbon monoxide, volatile organic compounds VOCs and a wide rage of particulate matter PMs that include ash, black carbon BC and organic carbon, such as Polycyclic Aromatic Hydrocarbons PAHs.

The smoke is a very complicated mixture of pollutants in the air, and it affects human health. It comes from lots of different sources, including trees, decomposed leaves, animals, forest litter and sometimes from local houses. Even the composition of the air pollution is depending on the way the smoke is created, for example by smouldering or flaming.

How to protect yourselves?

If you live close to a forest then ask your local authorities how you can help to protect the Earth’s lungs. If you happen to be near a wildfire/forest fire then remember to wear a N95 or N99 face mask. Don’t expose yourself in the smoke for a long time, even the face masks have a limit. If you live near an ongoing wildfire, close the windows and seal your house from the outdoor air. Stay away from your house for a few days, ask a family member who lives far away from the fire to host you.

Request

I can’t stand reading or watching on TV news regarding wildfires. The damage is huge especially when humans are responsable for them. My heart breaks every time. Please respect the environment. Thank you.

DIY PM Monitor Take 2

Do you remember this DIY Low cost DIY PM Monitor, there is a new and better version available.

The new version offers a low cost housing and the software is more mature now. The software is open source, on github, and there are some pre-built images on their website.

A great new feature is the ability to store of a few days of data on the device which makes it more robust to internet outages and usable for periods away from wifi access, and it records every sample from the PMS5003 sensor which is more that one per second to better capture quick changes and better for mapping walking around.

You can find all the instructions on their website.

Why I am in favour of Air Quality Sensors

Why am I in favour of air quality sensors and I support all AQI monitors and sensors independently their price tag?

Because they help us literally See the Air. They are the only tools we can use to get hard evidence that air pollution exists and raise awareness. Someone could say that inaccurate and probably cheap sensors are useless and I will agree in some level but you have to keep in mind that not everyone can afford a +1000$ sensor. Those “cheap” sensors will allow people to discover what they breathe in some level, act on it and will make them more conscious about the pollution. I truly believe that sensors will shape future societies.

Sometimes when I talk to people about air pollution some of them don’t seem to understand that air pollution exists. They have never thought that the black smoke exiting a car is a harmful pollution. They have never thought that lighting the fireplace for a “cosy” moment has effects and consequences. They have never thought that air pollution is everywhere and can affect everyone.

When evidences are presented, people start to think and wonder. A fundamental action which distinguish humans from animals. At that moment people make a huge difference as human beings and the Oxygen that is consumed by them is not a waste. Education is the key to a better future.

uHoo vs AirVisual vs Awair

On this article I am going to compare three AQI monitors: AirVisual, uHoo and Awair.

All the monitors were placed together in the guest room in my house, as you can see on the picture above. I chose that room because I wanted to be able to isolate the devices from the rest of the house and from human interaction especially for the first 21 measurements. No one was allowed in that room during those measurements. After those 21 random measurements which were taken during 4 days period of time I opened the door and I created some “air pollution”. The whole experiment lasted 10 days. Below you can see the graphs with all the sensors and monitors.

Read More »

Curious Air Facts!

-How much air an average human breathe?

We breathe around 11,000 liters / 388 cubic feet of air in a day.

-How much oxygen an average human breathe?

We breathe 550 liters / 19 cubic feet of Oxygen per day.

-How much oxygen does a house plant produce?

A typical houseplant leaf produces about 5 ml of oxygen per hour (more when it is growing, less when carbon dioxide levels are higher, that is, the more oxygen you breathe in and carbon dioxide you breathe out, the less oxygen plants make, less at night).

-How much carbon dioxide is absorbed by trees?

A tree can absorb as much as 22Kg of carbon dioxide per year and can sequester 1 ton of carbon dioxide by the time it reaches 45 years old.

-What plants give off the most oxygen?

  1. Garden Mum
  2. Spider Plant
  3. Dracaena
  4. Ficus/Weeping Fig
  5. Peace Lily
  6. Boston Fern
  7. Snake Plant/Mother-in-Law’s Tongue

-Which trees absorb the most carbon dioxide?

  1. Pine (Ponderosa, red, white and Hispaniolan pines)
  2. Oake (Scarlet, Red and Virginia Live Oak)
  3. Douglas fir
  4. Bald Cypress
  5. Common Horse-chestnut
  6. Black Walnut
  7. London Plane

-How many plants should you have in your house?

The NASA studies on indoor pollution done in 1989 recommends 15 to 18 plants in 6 to 8-inch- diameter pots to clean the air in an average 1,800Ft²/167m². That’s roughly one plant per 100Ft²/9,2m² of floor space.

-How many plants are needed for a human to survive in an isolated room?

Scientists estimate a safe oxygen consumption of 50 liters per hour for a human. Meanwhile, a leaf gives off about 5 millilitres of oxygen per hour. A person would need to be in a room with about ten thousand leaves. About 300 to 500 plants would produce the right amount of oxygen, but it’s much harder to estimate the amount of carbon dioxide the plants absorb, especially if every time a person breathes out, they inhibit oxygen production. To be safe, don’t get into an airlock room without bringing about seven hundred potted plants with you.

“See The Air” & “Nicholas and his incredible eyesight” Books

“See The Air”

Years of experience and personal research made me write and design this straightforward guide-book about air pollution. All the crucial information are inside this book, see the air you breathe today. Available on Paperback and Digital.

“Nicholas and his incredible eyesight”

Nicholas is a Scottish boy who will help your kids understand better what Air Pollution is and what they need to do to combat it. Through his empowering story he will teach them how to be more sustainable and thoughtful with the environment. Available on Paperback, Digital and Limited Edition Hardcover.

“Nicholas – The Science Book”

Let’s make a journey around the world and learn everything about the air we breathe. We are going to learn about the Earth’s atmosphere, the composition of the air and the most common air pollutants. In addition, we will learn how air pollution negatively affects humans and the environment. Available on Paperback.

Nicholas and his incredible eyesight | Book

I am proud to announce my second book “Nicholas and his incredible eyesight” which is my second attempt to raise awareness on air pollution and this time by educating the youth.

The book is for all kids, the story is full of lovely and colourful drawings and at the end of the book the kids will have the opportunity to do some fun activities.

Synopsis of the story

Nicholas is a Scottish boy who lives in a small beautiful town in Scotland. He has to move with his family to London for a while. There and with the help of his teacher he will discover his unique super power.

The book is available on digital and paperback formats through the following stores:

Layer 3Layer 5Layer 4


If you are interested in a (Limited Edition) HardCover copy of my new book, please Contact me or Tweet me for more details.

ISBN-13: 9788469752708