During and after the wildfires on the west coast of the United States the PurpleAir II (PA-II) network of low-cost monitors grew exponentially and has reached a number of about 11000 units. The reason was simple, people wanted to see when it was safe to go outside and/or open the windows.
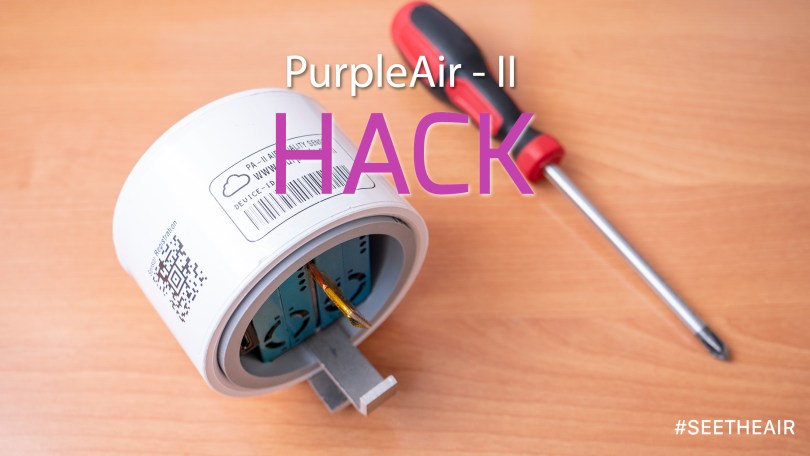
Although the PA-II is a small cute particulate matter monitor, it has a flaw. The temperature and humidity sensor (Bosch BME280) is placed too close to the rest of the electronic components. As a result, neither the temperature nor the humidity reflects the real values of these environmental parameters. All electronics produce heat, and they may interfere with other sensors, and this is the case with the PA-II.
By the time someone invests money on a device with an array of sensors they want to be able to take valuable measurements for all the parameters. For this reason, I figured out how to improve the temperature and humidity measurements in order to reflect the real conditions outdoors or indoors as some people place the monitors indoors too.
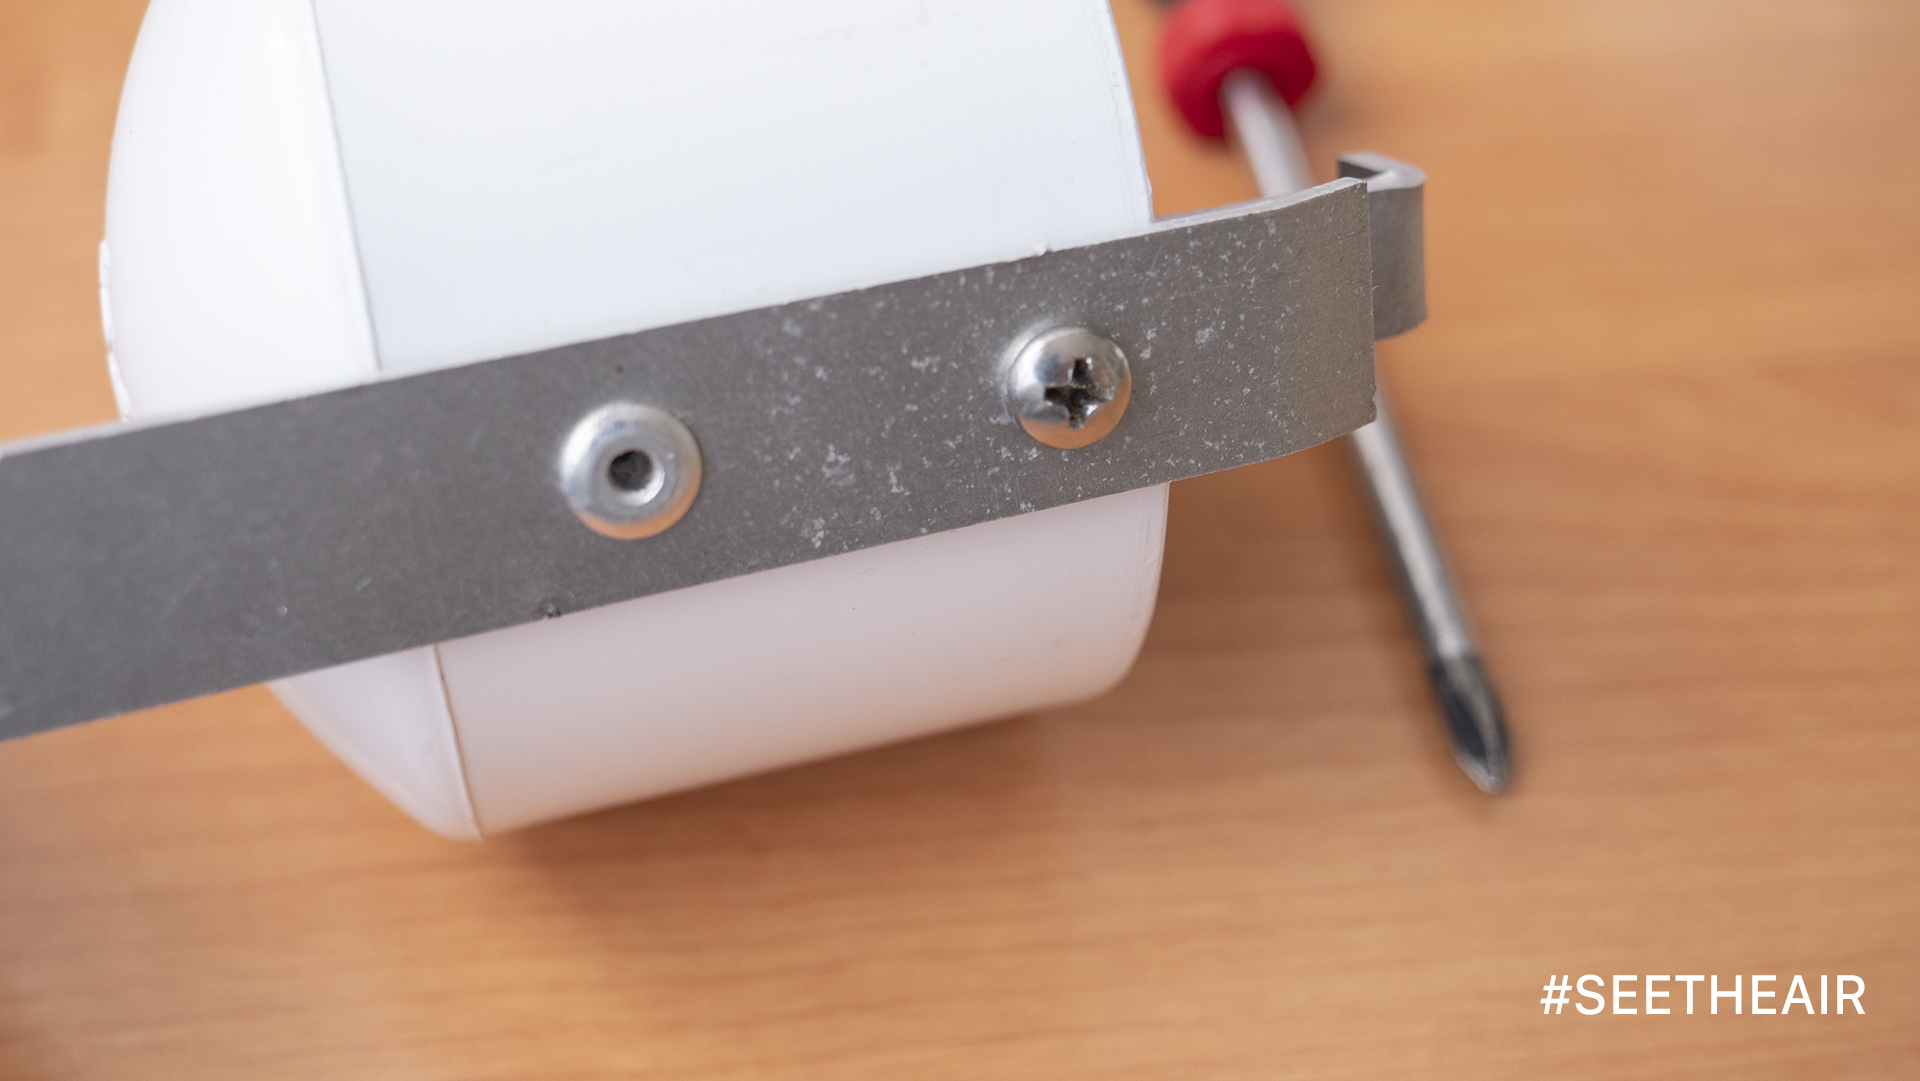
It is easy to take apart the device, as there is only one screw. Once it is unscrewed, you need to pull the sensors out of the white case. Don’t worry because they are holding each other with some stickers.
There is a demand for Green Buildings lately, which focus on the comfort and health of the building’s occupants. Energy efficiency was the original target for most of the green buildings certifications programs, but they have evolved, and they now focus on many more aspects of the indoor environments. Indoor Air Quality has become the number one priority for many green building certifications, and in order to be certified, there are strict rules for ventilation and AQ monitoring.
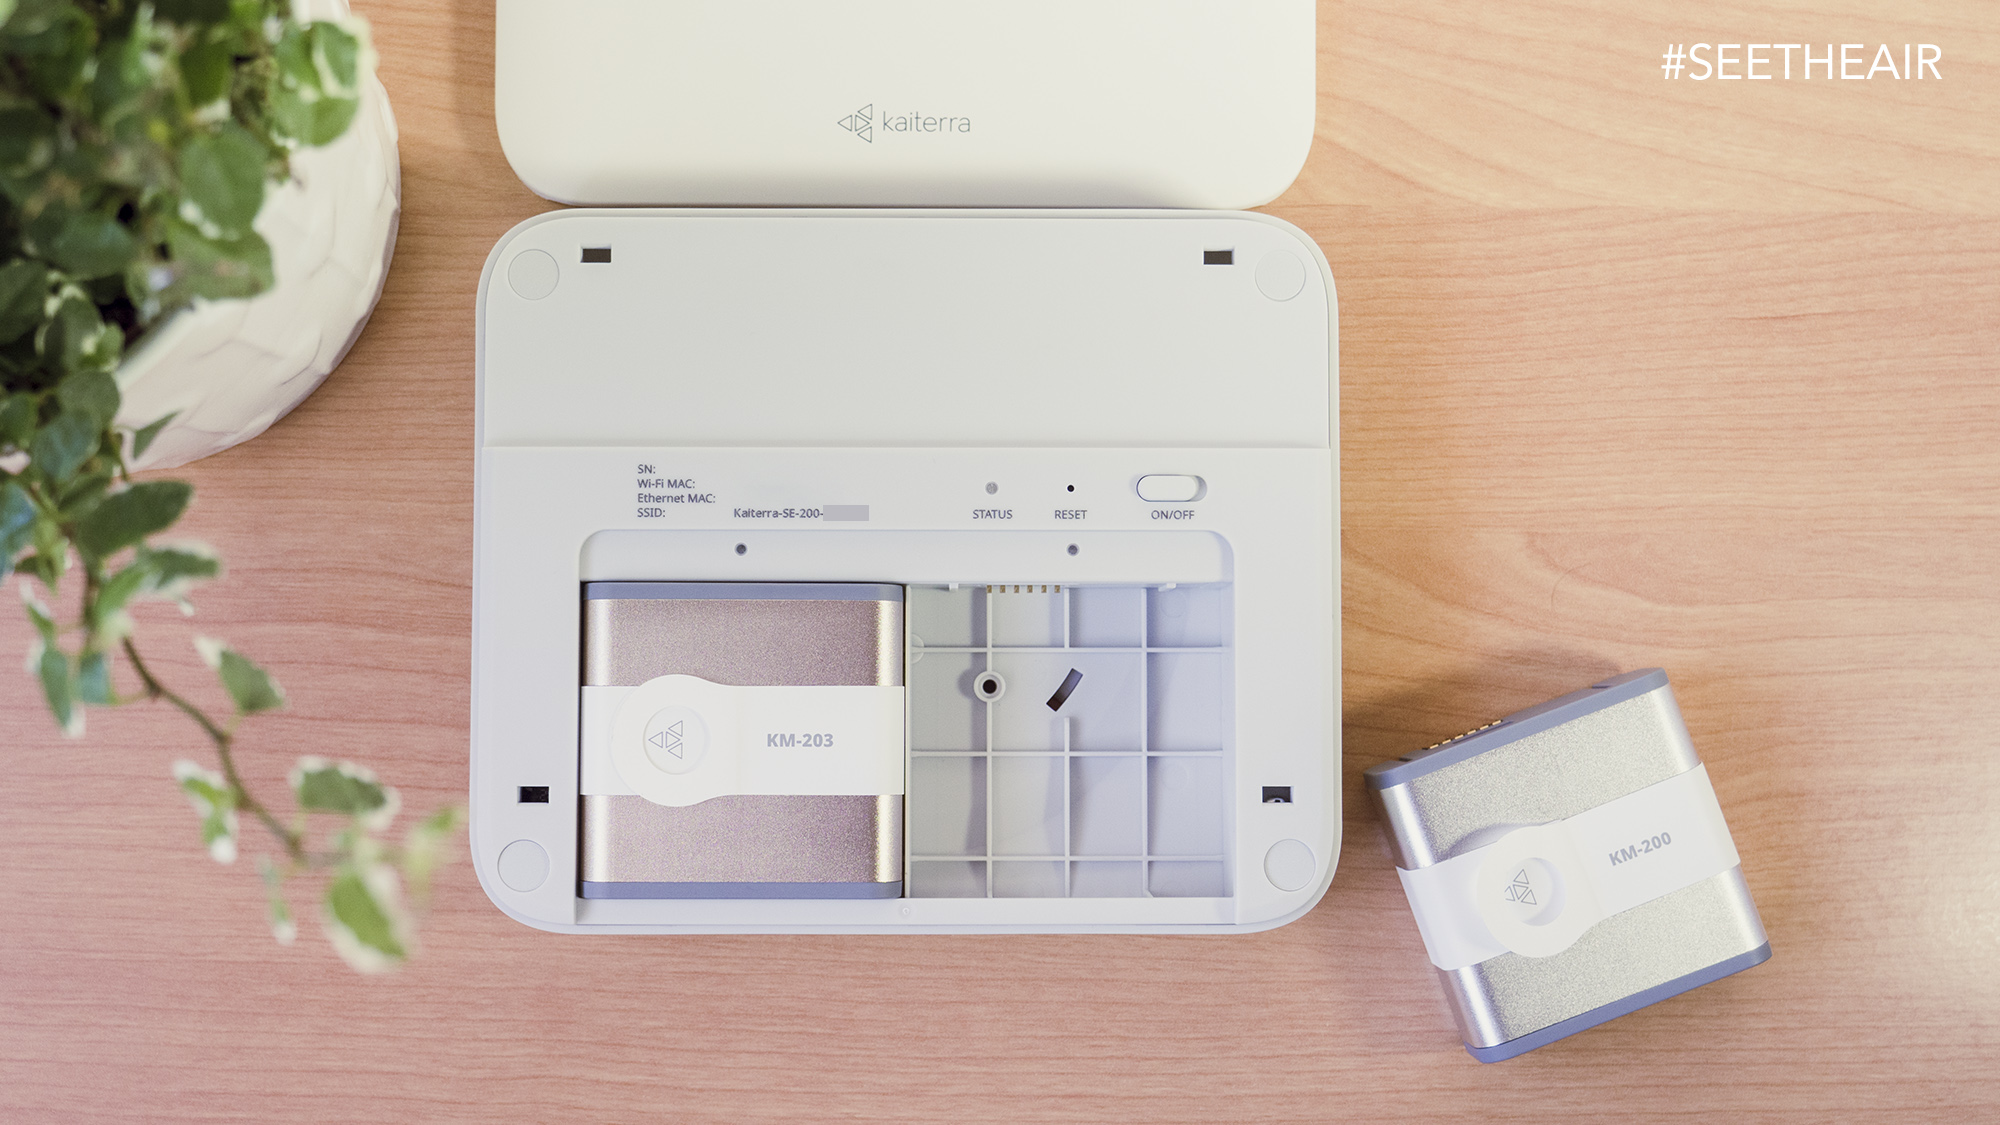
Here comes Kaiterra Sensedge Mini, which is a RESET certified indoor air quality monitor. The Sensedge Mini is a calibrated real-time monitor that has to be placed in buildings that wish to obtain a Green Buildings certification.
The Sensedge Mini uses two removable sensor modules to replace the traditional, costly calibration processes for long-term accuracy with minimal maintenance.
Like every year, at the end of December, I write an article about my blog statistics and environmental news related to air quality and air pollution that shaped the planet during the year.
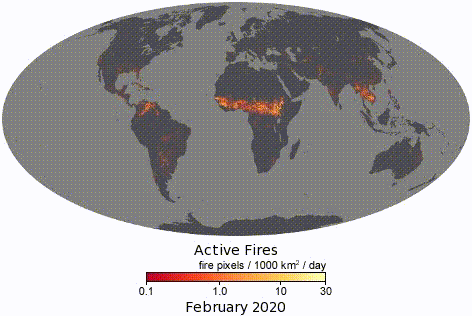
2020 was one of the worst years in history due to the COVID-19 pandemic, but also because of the massive wildfires that have burnt vital forests and they have destroyed ecosystems.
Wildfires are by-products of climate change, and they will get worse. Also, get ready for floods.
In 2020, over 9,279 fires have burned more than 4,359,517 acres, which equals to 4% of the roughly 100 million acres of land in the US. The effects of smoke could be long-lasting. Kids and asthmatic are especially at risk. Personally, I believe that air pollution affects everybody, the difference is that kids and elders are more likely to experience the consequences in the short-term.
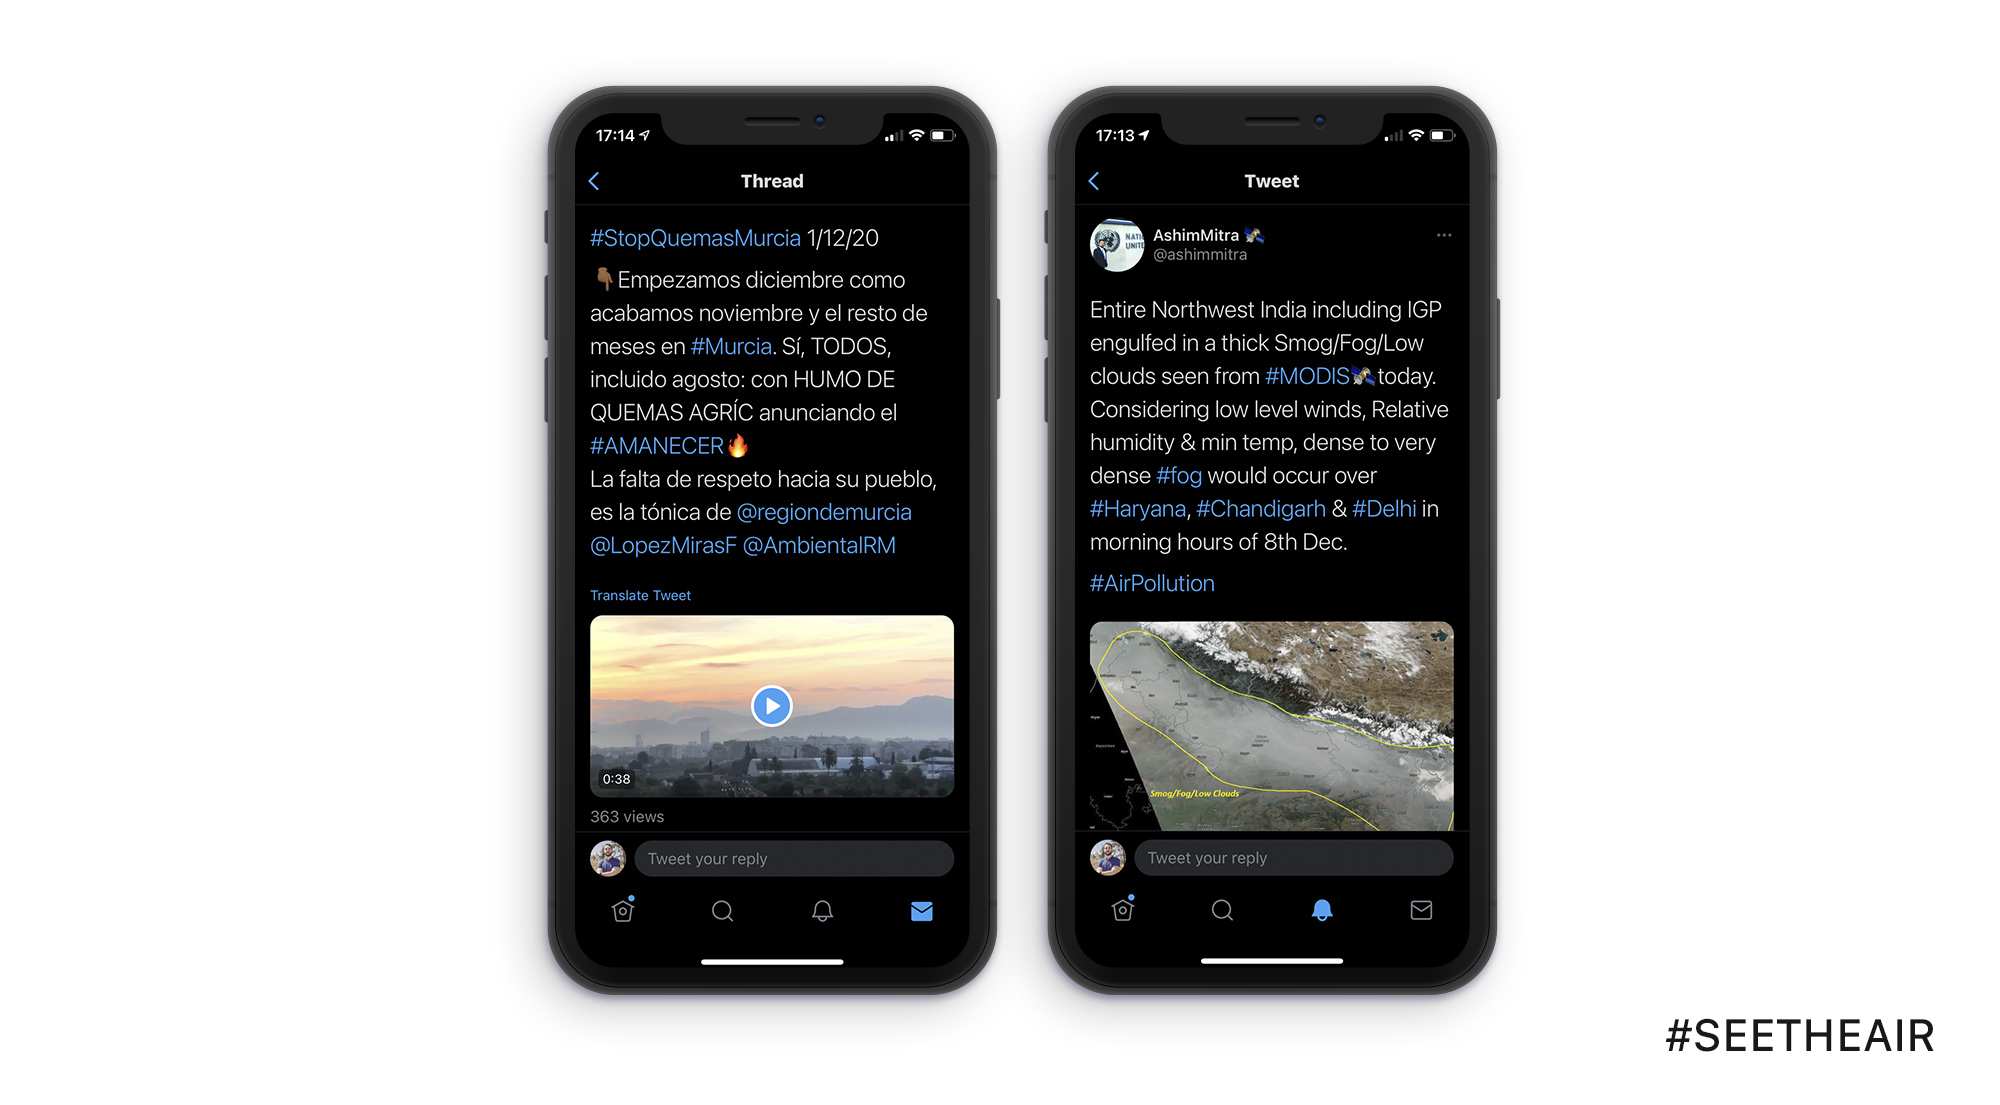
Unfortunately, fires are not only a naturally occurring event. Each year we burn a lot of things. From stubble burning to wood burning for heating and from stupid and archaic bonfires to BBQs. I receive emails and tweets from people all over the world where people share with me their experience with air pollution.
Each year in late-October, farmers in northern India burn off crop debris, a practice known as stubbleburning. They don’t take into consideration their health and the health of the people that live miles away from them, and they will have to breathe this toxic mixture of gases and particles. In Murcia, a southern city in Spain, people suffer every single day from fires and smoke because of the practice of agricultural burning, which is prohibited by the Spanish Law 22/2011. The examples are endless, believe me, and they are present all over the world. It doesn’t matter if you live in a developed or developing country.
#StopQuemasMurcia #India #AirPollution
Another important piece of news in 2020 was the ruling that made 9-year-old Ella Kissi-Debrah the first person in the world for whom air pollution is listed as a cause of death. This is a legal history in the UK, and I hope people won’t forget it. My sincere respect to the family for their hard work to raise awareness about air pollution.
In most cases, political unwillingness to address the issue or apply the already established laws are the reasons each year the same events happen. Lowering the life expectancy and creating numerous health issues to the citizens from Alzheimer’s disease to diabetes and heart failure to pregnancy loss to name a few.
Statistics
Each year, my blog receives almost double the amount of traffic as the year before. However, due to the COVID-19 and the wildfires in 2020, the blog was reached by 193K visitors in 2020, which is three times more than last year. Keep in mind, my blog is all about air pollution/quality, a very narrow subject but at the same time very important for all of us. Google, Twitter, and Facebook are the top three referrers to my blog.
In 2020 scientists published a lot of papers about air pollution, associating it with subjective health, morbidity, and mortality. They even found a correlation between air pollution and COVID-19 in big cities. In another study, scientists estimate that exposure to air pollution increases COVID-19 deaths by 15% worldwide.
It is our responsibility not to close our eyes and see the air we breathe.
The Wynd Halo 1st Edition uses a proprietary PM sensor with a blue-light laser instead of a red-light laser, which presumably makes it more accurate and precise. Interestingly, I remember during the Kickstarter campaign of the monitor, backers were asking the company if they will sell the sensor as a component part to third parties, and they said yes because it was about to revolutionize the industry.
Although I don’t have a reference monitor, the comparison I conducted is considered a field evaluation in a real-life situation. AQ Monitors are designed to operate inside apartments and buildings for this reason I personally value more a field evaluation in situ than a lab evaluation where every parameter is controlled.
This kind of evaluation won’t tell us how accurate is the sensor, but it will reveal the correlation against other monitors in order to determine if measure something respectable. For example, there are many field and lab evaluations for the commonly found Plantower PMS5003 sensor that demonstrate a correlation of 0.78 – 0.93 against various reference monitors.
After almost two months of asking local schools for permission to install air quality monitors in their classrooms, on the 4th of December, a local school decided to grant me access.
In my city, Almeria, Spain, there are about 110 schools. I didn’t apply to all of them because each time I managed to find a way to contact them, I had to arrange a meeting in order to explain to them what I wanted to do, and all this process takes time. I managed to contact nine schools.
For this study, schools didn’t have to pay anything, so money wasn’t the issue for their refusal. They were worried about what will happen if the results were disappointing and negative. I tried to explain to them that the aim of the study is to understand what is going on in the classroom, in real conditions, with real students. I don’t want to discredit the school either the local authorities that manage the budget for the school. For this reason, I will keep the name of the school private.
Monitors
The monitors that I have installed for the study are made by Airthings. There are two Wave Plus, which include a CO2 sensor by Senseair. The sensor is called Sunrise, and it is an ultra-low-power, high precision NDIR sensor. Accuracy (CO2) ±30 ppm ±3% of reading. Finally, it features a self-correction system that allows them to auto-calibrate every 180 hours. I also have included a Wave mini monitor in the teacher’s office room.
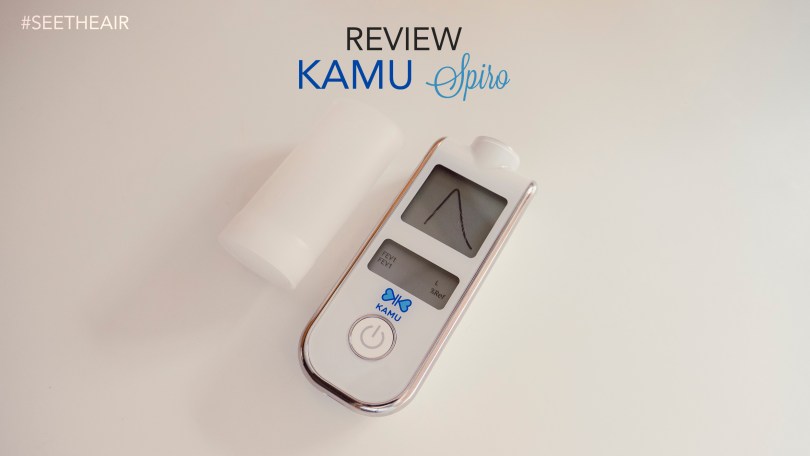
I have been talking about air quality monitors and air purifiers in this blog for a long time. They help us see the air we breathe and mitigate pollution. However, is there a way to measure the impact of pollution on our lungs?
Well yes, thanks to technological advances and spirometry, which measures lung function, doctors can use these data in assessing breathing patterns that identify conditions such as asthma, pulmonary fibrosis, cystic fibrosis, and COPD.
In this review, I am going to present to you the KAMU Spiro. It is a handheld bluetooth device that helps us test our lung function at home with a hospital-grade mobile spirometer.
With a single test, we can get FEV1, FEV1/FEV6, FVC, and PEF values. The spirometry results are saved in KAMU Spiro’s memory until we upload them to our KAMU Asthma app, where we can view them at any time.
Apple iOS 14 has brought many new features to phones and tablets. For the first time, I enrolled in the beta versions of the operating system for the iPhone just because I wanted to explore the user experience (UX) of the widgets.
Long story short, I really loved them, especially the weather widget because of how intuitive it is about the information that it displays. Generally, we are accustomed to the static widgets that they only update the information every 10 minutes and that’s all, but what Apple did with the weather widget was phenomenal. Depending on the time of the day it is able to display the most important information for users to read and make appropriate decisions.
During the day, you can see the current temperature and weather forecast for the following 6 hours, plus the highest and lowest temperature of the day. However, during the night, it makes a short suggestion about the following day, for example, Warmer tomorrow with a high of 29ºC. It is fantastic because you can plan the day ahead. I call this feature Adaptive Information, and this is what I will value as a user from an air quality monitor or and AQ app.
Have you ever wondered if the gases we produce as humans are toxic to those who live with us?
It is a taboo but I think we all have thought about it at one moment in our lives. Scientifically known as flatus but commonly known as a fart, many of us even use funny expressions to cope with this uncomfortable situation they create like Acid-rain maker, After the thunder comes the rain, Baking brownies, Death Breath, Fire a stink torpedo, pass the gas, etc…
Let’s take a step back and analyze the chemical composition of a flatus. More than 99% of the volume of flatus is composed of non-smelly gases. These include oxygen (O2), nitrogen (N), carbon dioxide (CO2) hydrogen (H) and methane (CH4), keep in mind, methane is a colorless, odorless gas and nitrogen is not produced in the gut, but it is a component of environmental air. The remaining trace (<1% volume) compounds give flatus its smell which comes from a combination of volatile sulfur compounds. Hydrogen sulfide (H₂S), methyl mercaptan (CH4S), dimethyl sulfide (C2H6S), dimethyl disulfide (C2H6S2), and dimethyl trisulfide (C2H6S3).Read More »
There are a few things you can do to reduce air pollution indoors like keeping things tight and clean, not smoking, using exhaust fans when you cook, and ventilating the rooms, but at the end of the day if the air pollution comes from outside sources then you need to take drastic measures and there is only one solution, investing in an air purifier.
There are many air purifiers on the market for all types of budgets but you shouldn’t expect a cheap air purifier to offer the same features and purification results as a high-end purifier. By the way, air cleaners and air purifiers are the same things.
BRISE C360 is a high-end purifier capable of purifying up to 95 m2 or 1022 ft2 room and rated CADR at 390 m3/hr or 230CFM. It is recommended for medium size rooms and it packs a ton of features.
In a previous post, I presented Airthinx IAQ for Homeowners and how an advanced AQ monitor can be used for indoor environmental monitoring. In this post, we will explore how we can use the same monitor but in business environments (offices, industrial buildings, food supply chains, etc).
We will focus on the tools present in the dashboard as it is one of the best dashboards you will find in the market, and we will learn how to get the most out of it.
Let’s begin with the Dashboard – Home. Here we can create various types of widgets and arrange them according to our preference. First, you can see that I have created a column with all the current measurements with small graphs of the environmental parameters. Right next to it, I always watch for the general AQ, PM2.5, and Humidity. Below I have more widgets with other graphs and values that I want to have a glance.
Dashboard – Home
Next, we can see the Map tab. Here we can locate all the available monitors in a high precision as the monitors come with a GPS module, however, we will see later that we can manually set the location of the device.