I wasn’t planning to write an article about the Coronavirus but after WHO declaring it a pandemic and as I receive a lot of traffic from people who try to find a good mask to protect themselves from the disease I changed my mind and I wrote a few lines on how I see the whole situation.
Better Air Quality
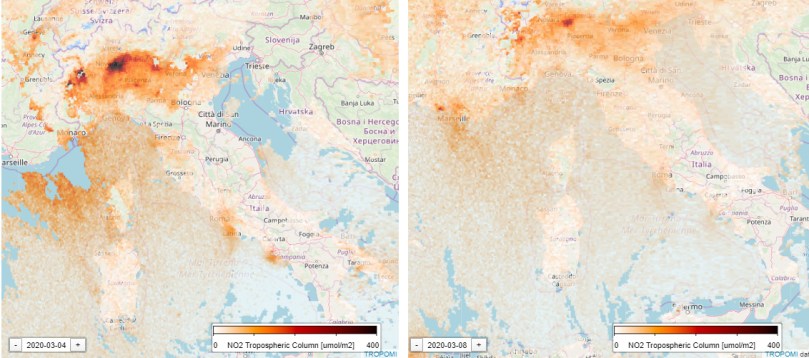
As you may have already read a NASA satellite took some pictures in Mainland China before and after the outbreak of the Covid-19. The imagery illustrates air pollution and how the concentrations of air pollutants have decreased dramatically after people were ordered to stay in quarantine. The same thing happened in Italy as the government restricted the movement and most Italians stayed at home.
The virus was able to achieve something that I and many fellow clean air advocates try to accomplish for quite some time now, to decrease air pollution in the urban environment.
The restriction of movement proves the fact that the majority of urban air pollution is anthropogenic and mostly due to inefficient transports. Diesel and petrol cars, old buses, vans, vehicle tires and many more. Vehicles don’t move around alone though, we are the drivers, as a result, we can do better.
Madness and misinformation
The madness of buying tones of toilet paper proves how humans are panicking and they are in a survival mode. They copy unconsciously others’ behavior, which is a primitive instinct, in order to make sure they are safe. Covid-19 is a respiratory infection which means it doesn’t mess with your digestive system.
Misinformation is a powerful tool for the exploiters who will say anything to you in order to scare you and of course to take your money. Read and listen to news from trusted sources and make sure you double-check them.
Don’t panic!
Wash your hands well, avoid touching your face and keep your personal belongings clean, like smartphones, computers, glasses, etc.
Masks
Face masks can offer a level of protection if they are well designed and of course, if you maintain them and keep them clean too. If a mask catches a virus, the virus can stay alive for hours and up to a few days.
Conclusion
Some believe that we have to isolate ourselves in a global scale in order to eradicate the disease, however, economically, I am not sure if we can afford it. In addition, spring is almost here (in my city temperatures are reaching 23°C) which makes it much more difficult for people to stay indoors.
I am not an expert in that area but what do you believe? Should we close all businesses and institutes for 2-3 weeks and stay indoors?
I managed to grant permission from the local authorities (Junta de Andalucia) here in my city Almeria to place two low-cost monitors among the reference instruments in order to determine whether the two consumer products could offer fair readings to the users.
After filing some paperwork and the help of the responsible people in my city, they granted me access to the reference Monitor ES1393A (Mediterráneo) that complies with all EU standards. It is a quite powerful station as it is equipped with many expensive instruments (figure 1) which measure many types of pollutants, such as Nitrogen Oxide (NO), Nitrogen Dioxide (NO2), ground-level Ozone (O3), Carbon Monoxide (CO), Sulphur Dioxide (SO2), PM10, PM2.5 and many more.
The portable consumer-grade monitors that I placed in the reference AQ station were the Atmotube Pro and the Flow 2. Of course, I placed them outside the station and I attached them to the PM2.5 beta attenuation monitor air inlet (as you can see in figure 2) because I wanted to ensure the greatest PM2.5 correlation possible.
A beta attenuation monitor (BAM) is a universally used air monitoring technique that employs the absorption of beta radiation by solid particles extracted from airflow. This technique allows for the precise detection of PM2.5 without humidity affecting the results (a common problem for the laser scattering sensors). However, there are some drawbacks, for instance, it doesn’t provide data in real-time and it takes only a few measurements in an hour.
Figure 1: Air Pollution Monitors
Figure 2: BAM air inlet and Portable AQ Monitors
The portable monitors took measurements continuously for three and a half days with an interval of 1 minute between each measurement. The reference monitors took measurements every 10 minutes, so the data from the reference monitor are not as dense as from the Atmotube and Flow but are much more accurate and even without the same density we will be able to get a good idea of what is going on.
Before presenting the results from this comparison, I would like to mention that my measurements cannot be taken as a “de facto”. In order to determine the real correlation of a monitor or a sensor, you need at least 3 units and various days to months of data. Maybe some other units from both parties, PlumeLabs and Atmotube, may give different results. The climate also affects the performance of the sensors, so a different geographical location can give us different results.
Nitrogen Dioxide
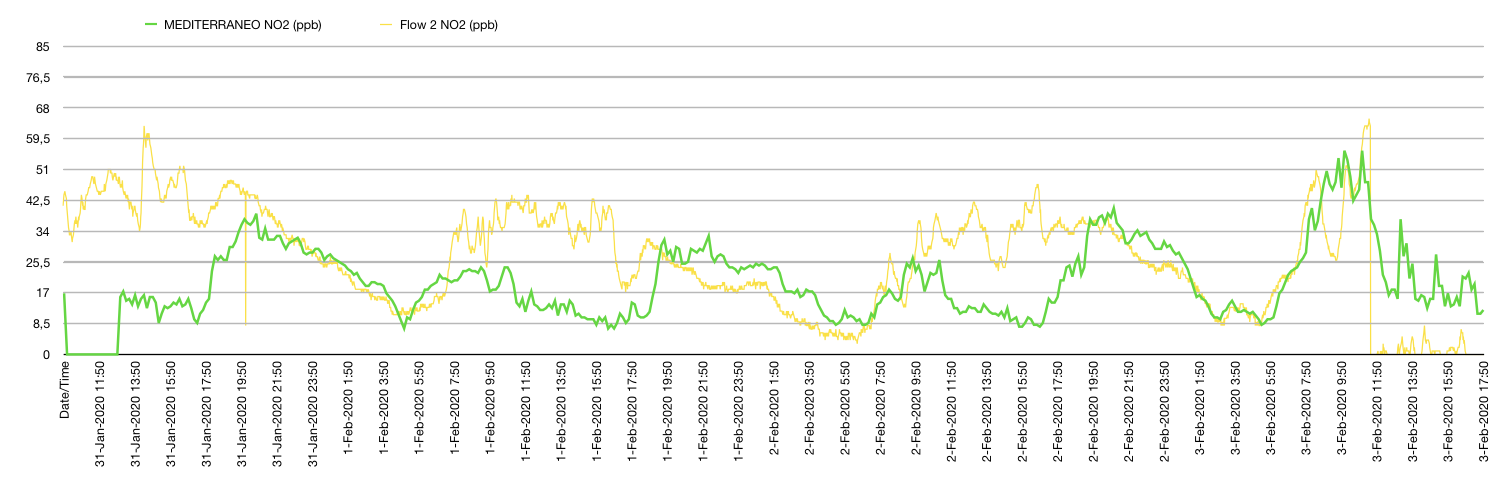
Let’s begin with the comparison of the NO2 gas sensor inside the Flow 2 and the reference monitor Teledyne Model 200E. The official measurements were in μg/m3 so I had to convert them into parts per billion (ppb). Converting the original values to ppb is not an easy task as you have to know the molecular weight of the pollutants (NO2=46.0055g/mol) and most importantly the temperature and atmospheric pressure at the time each value was taken, the problem was that they didn’t provide me with that data and I didn’t have them either. As a result, I looked them up and the average values were 15°C/59°F and 1019hPa, so to simplify my workflow I used those numbers in the formula for all the conversions. I know, I know, the data from the reference monitor are not 100% correct now but they are very close so they will do the trick.
Green: Teledyne Model 200E | Yellow: Flow 2
As you can see in the graph above there are quite many similarities in the trajectory of the lines. I was quite surprised and happy to be honest. You can clearly see how the low-cost sensor keeps getting exited from the pollutant(s) for a longer time but it was able to follow the official measurements. Keep that in mind, the official monitor Teledyne Model 200E worths around 8,000€ and Flow worths 159€.
Particulate Matter
Let’s continue our comparison with the Particulate Matter sensors from Atmotube Pro and Flow 2. Firstly, let’s see the PM10 measurements as the reference monitor Met One Instrument BAM 1020 (~18,000€) only provided the PM10 concentrations. The air inlet for the PM10 was about a meter away from where the 2 portable AQ monitors were placed and this is one of the reasons we can see that the concentrations from the BAM 1020 were much higher than the low-cost sensors.
Atmotube was able to follow the same trajectory as the BAM 1020 and when I multiply by x3.0 the output concentrations of the Atmotube the trend was much more similar (see graph below). On the other hand, Flow 2 was not able to keep up with the reference monitor. Flow’s (Yellow) line does not follow the reference monitor and I was unable to find any correlation.
Red: Atmotube Pro with amplified x3 PM10 output.
As the BAM PM2.5 measurements are being analysed in a lab right now in order to ensure accuracy by the state I will compare the result in a different post. They gave me an estimation of about a month.
Conclusion
It gives you a level of confidence to know that the little AQ monitor that you carry with you is able to reveal the truth about the air you breathe. Although the results are not perfect they can provide some general guidelines to the users.
Stay tuned for the final PM2.5 comparison, will Flow 2 have better PM2.5 measurements and will Atmotube Pro keep up?
Recently, I gave an inverted to BreezoMeter, which is a company dedicated to providing air quality data, pollen reports and fire alerts globally. It was a great honour to be able to share my thoughts on the subject of air pollution.
I love portable devices and miniaturisation is a thing of the future. In this post, I am going to compare Flow 2 and Atmotube Pro side by side. Both devices are two portable Air Quality Monitors that can easily be carried around and help you see the air you breathe.
This is a preliminary test and I will compare the devices between each other. I have promised you an extensive comparison between the portable monitors and an official reference station, however, it will take a bit longer in order to sort things out with the local AQ department − paperwork which needs time from their end.
One day is left before the planet Earth, where 7.8 Billion people live, completes its orbit around the Sun. During our journey around the Sun and inside the universe we witnessed some good and bad moments for our planet and us.
We saw some terrible disasters like the Amazon rainforest wildfires, Bushfires in Australia, fires all over the world, which were very hard to control because of the extreme weather and climate change that rewards and favors such as extreme phenomenal to happen.
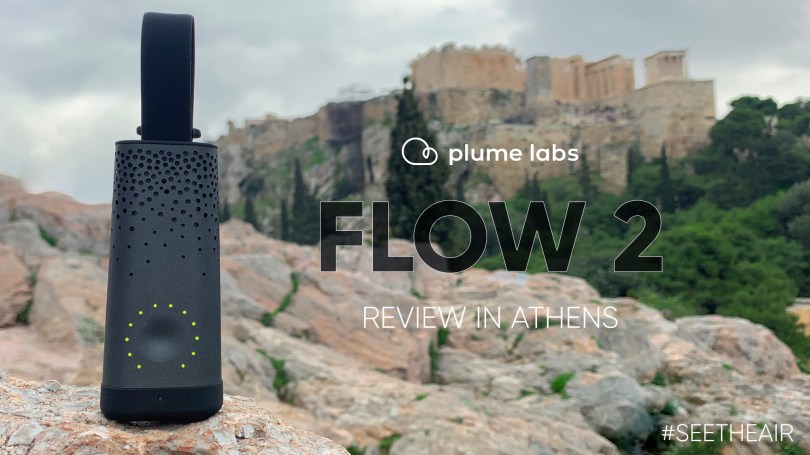
I was given the chance to review the brand new Flow 2 by Plume Labs and I took the opportunity to review it on my trip to Athens, Greece while visiting my family. Flow 2 is a small handheld AQ monitor that can follow you almost anywhere through the day and it tracks Particulate Matter, Nitrogen Dioxide and VOCs.
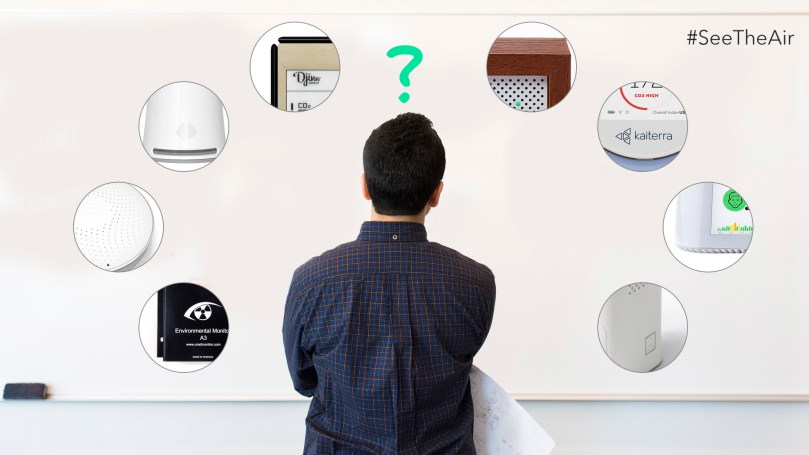
Which is the best indoor Air Quality Monitor for me?
I am sure you have asked this question a lot of times, many of them you have contacted me through my blog or social media platforms asking for my help. As a result, I decided to create a web tool to help you choose which one is best for your needs.
It’s super easy, just answer a few simple questions and the right Air Quality Monitor will pop up for you. Click below 👇
How important is to walk your kids and not to drive them to school?
Well, it is simple, it is very important for multiple reasons.
Less Air Pollution
Get to know your kids better
Socialisation
Less Stress & More Physical Activity
Economics
Less Air Pollution
Just today while I am writing this article a new study came out explaining that children are five times more exposed to toxic air on school run than other times of the day. This is normal if you take into account all the cars that queue up with the engines on and idling while waiting to drop kids off or pick them up.
In simple words, your kid’s health is at high risk!
I used to walk to school every single day, under the sun, under the rain and under the snow and guess what, I didn’t melt. It actually helped me wake up and be ready when classes started. A rainy day is a fun day for a kid and umbrellas have been invented for a long time now.
Get to know your kids better
My school was not far away from my house, 10min approximately, my mother or my aunt accompanied me and my cousin during pre-school and for the first year of primary school. It was great, we had the chance to talk calmly and for them to wish us a good day without worrying about where to park the car or the traffic lights or getting late. Walking distances are always the same as nothing can block your way.
Socialisation
During the walk to school, you have the chance to get to know other parents and your kids’ friends, talk to them and exchange opinions. Kids learn and copy their parents. Imagine being inside a car and you – the parent – are frustrated because you stuck in traffic or because another car bumped your car, most probably you will swear. Do you want your kid to learn that word from you?
During the socialisation that happens between you and the other parents, you have the chance to discuss important school issues and most likely resolve them. Also, you have the chance to invite them for a play day. Trust me your kids will love you.
Less Stress & More Physical Activity
As I have already mentioned, walking is relaxing and apparently good for your health too as it is considered a physical activity. The rest of the day you will be in the office or wherever place you work in and you will have time to sit. Fun fact, on average, we burn about 50 calories for every 10 minutes of walking.
Economics
Obviously, there are economic reasons to choose walking or cycling over driving but I am not going to discuss them here as I am trying to focus your attention on how to become a better more sustainable person, not a richer one.
To sum up, avoiding driving your kids to school won’t only reduce air pollution in your neighborhood with a direct benefit to your family’s health but it will help you become a better parent and it will also help you raise a healthier and more socially capable kid.
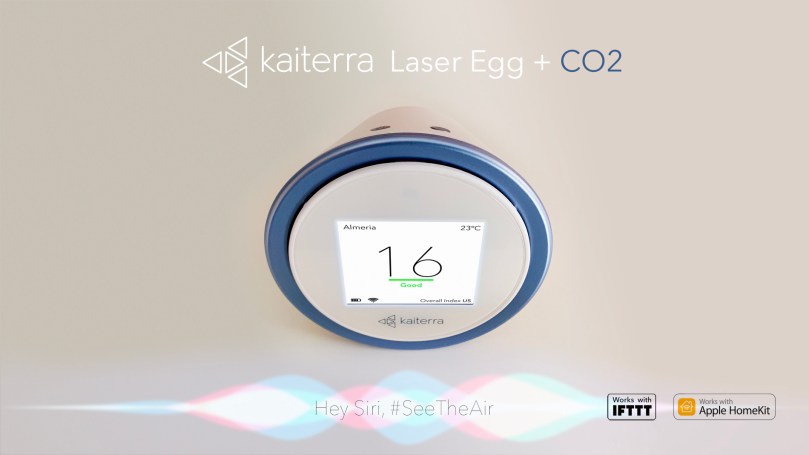
I was given the opportunity to review the brand new Laser Egg + CO2 monitor which is a new addition into the family of Kaiterra domestic air quality monitors.
This product is designed for those who work or stay lots of hours indoors and pay attention to how Carbon Dioxide CO2 can decrease our cognitive ability. The correlation between CO2 and productivity has been studied a lot for over 50 years by many academics.
Interesting facts, surprisingly, the design standard for CO2 levels in most buildings is 1000ppm but the recommended concentration is below 700ppm. In one of the studies, Harvard researchers have found significant negative impact at 930 ppm.
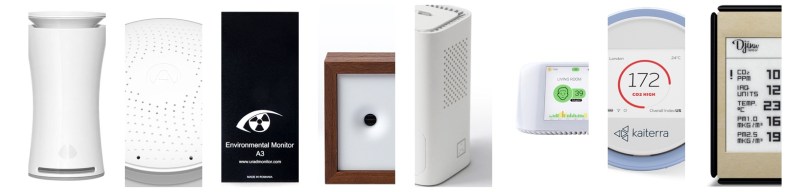
Here are all the available IAQ Monitors on the market 2019 Q4. There are so many devices out there but they all lack innovation and they all offer exactly the same technologies. Companies had better hear users feedback!