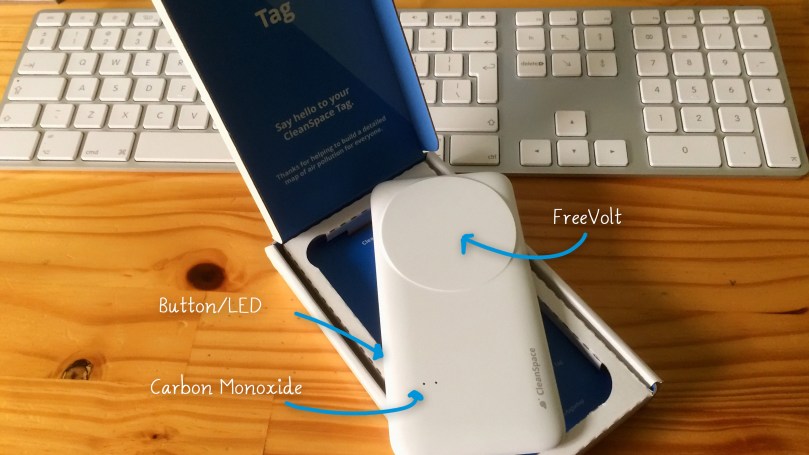
Reviewing the CleanSpace Tag was a priority for me as it is the only available affordable $50 and easy to carry on device that measures air pollution and helps #seetheair everywhere.
Features:
Carbon Monoxide CO Sensor 0.3 to 492 ppm
Temperature Sensor
Freevolt Technology
Bluetooth Smart (BLE)
It weighs only 51g. When I first took it on my hands I thought it was empty inside, but it wasn’t of course. It is almost the same size as the iPhone 5/5s/5c, but thinner which makes it super convenient for handling it. Also it comes in a cool packaging, recyclable 100%.
I always thought that air quality inside parking lots were suffocating. And now I have some proofs. I took a quick measurement with the CleanSpace Tag and left from there as soon as possible. 86.9ppm of Carbon Monoxide!!! Tragically there was a man without any kind of mask working inside this parking lot guiding drivers where to park.
Next week a complete review for the CleanSpace is coming. Stay tuned!
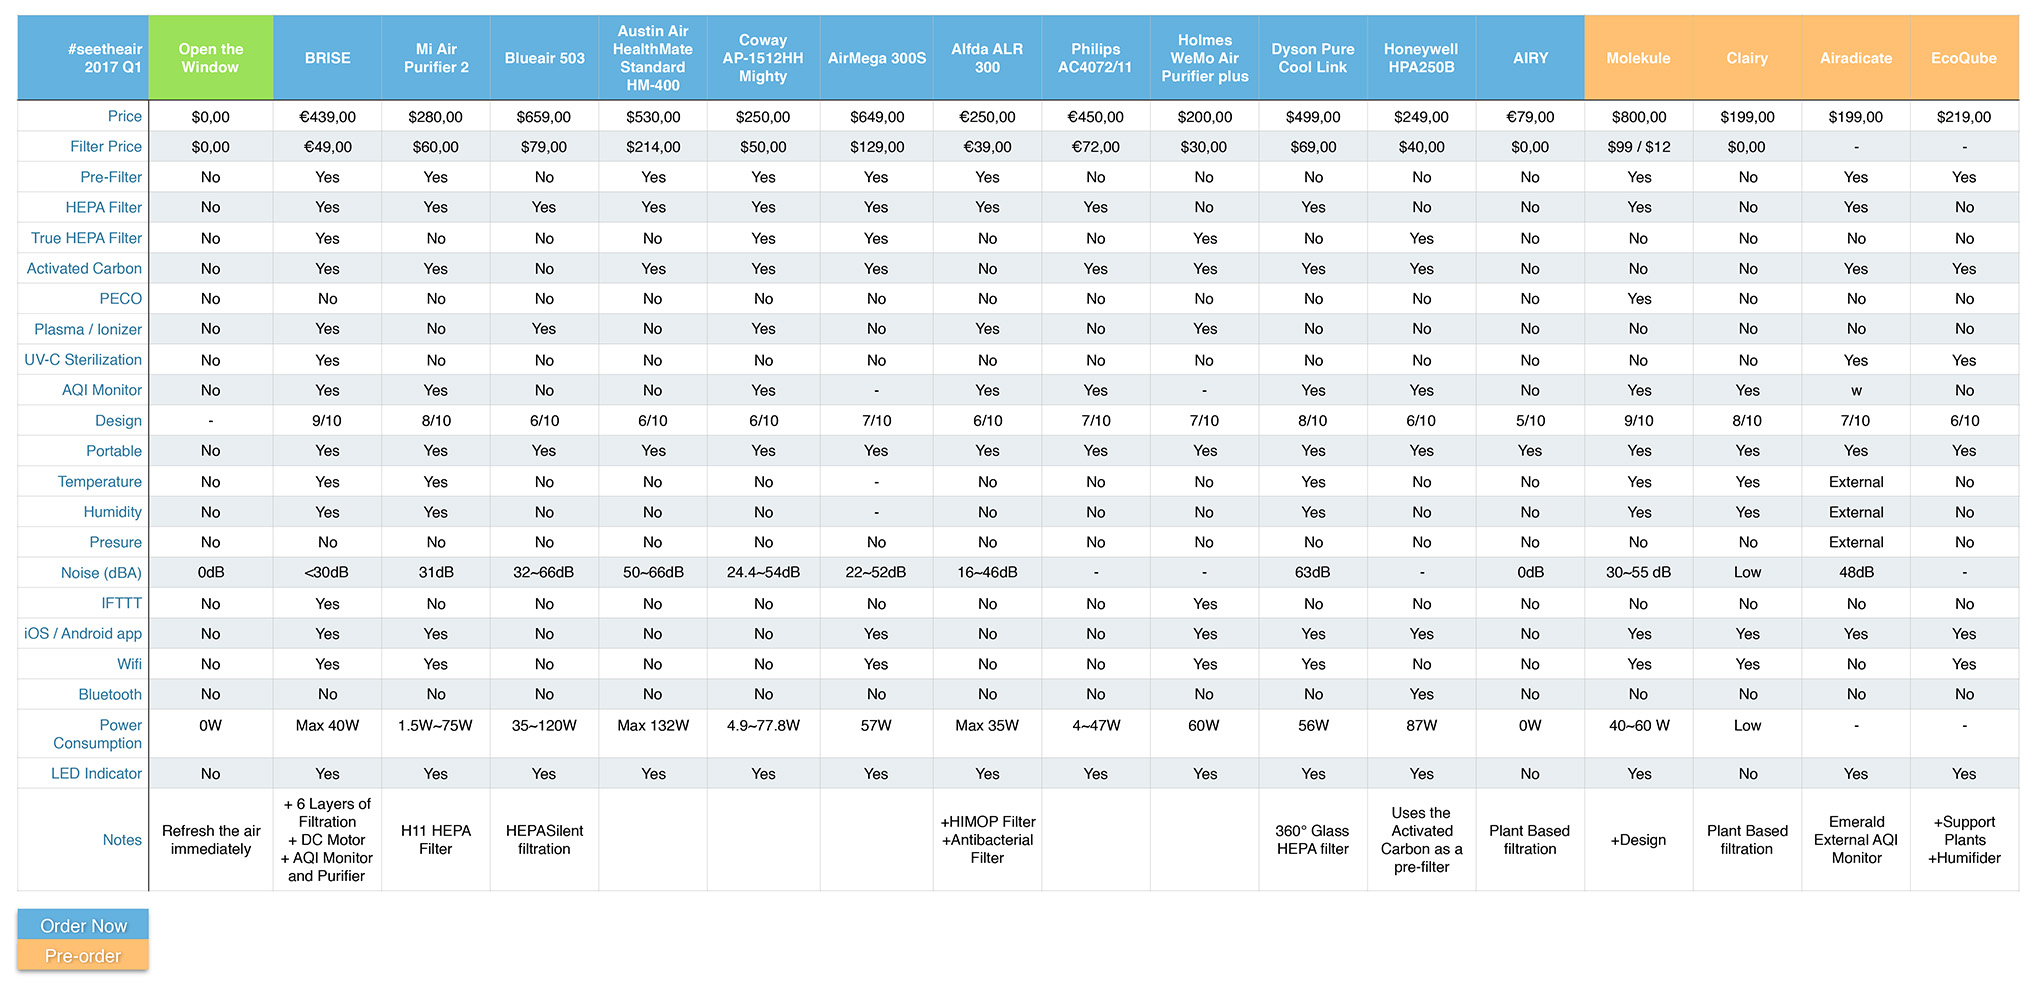
2017 New Air Purifiers in the market that use new ideas and technologies to clean the air from VOCs to PMs. As you can see on the green column I have mentioned the best and the cheapest way to improve air quality indoors, it’s a reminder for those that can apply this principle and when the outdoor air is cleaner than the indoor.
Prices may vary during time.
Some Companies don’t specify on their datasheets some of the infos.
There are hundreds of air purifiers out there I have just included some of them, if you want to suggest another one please feel free to mention it on a comment below and I will be happy to add it.
The classification of the design is based on my personal criteria, what’s aesthetically nice or not.
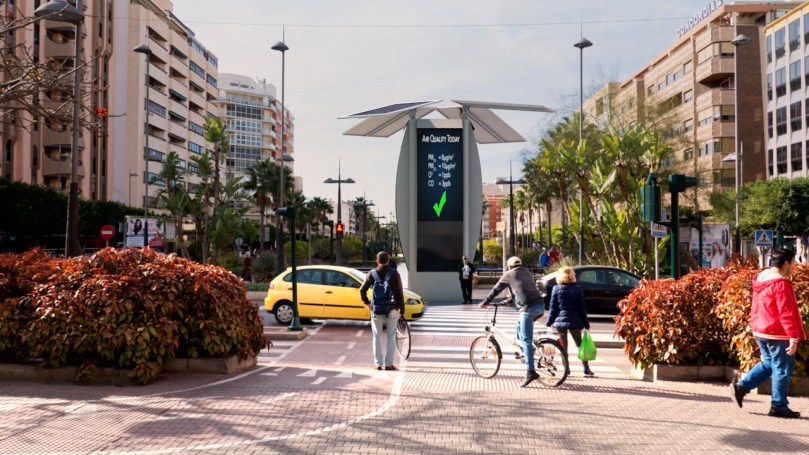
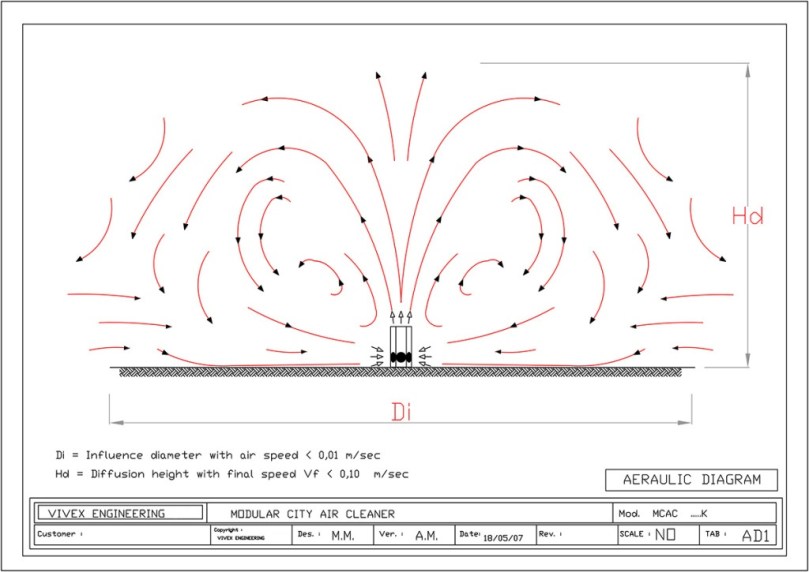
The Modular City Air Cleaner aka MCAC is a stracture-device made by a company called Vivex Engineering. Their aim is to alleviate cities from air pollution.
Well, we all know how polluted is the air in cities full of thin dust that are residual of rust, asphalt, tyres, rubber, various ashes, crumble of cement, stones and other more.
The MCACcan be realized in various shapes in function of the final destination of use and can be equipped with or without internal fans (in case of canalized applications). What is even more great about the MCAC is that has been designed as a power saving-oriented machine and it can be equipped with photovoltaic panels for energetic autonomy. It can be integrated in already existing structures as for example inside the beams of a bridge. The generator looks very compact size, has a pressure drop of about 10 Pa and has a very low power consumption of approximately 40W per1000m³/h of treated air.
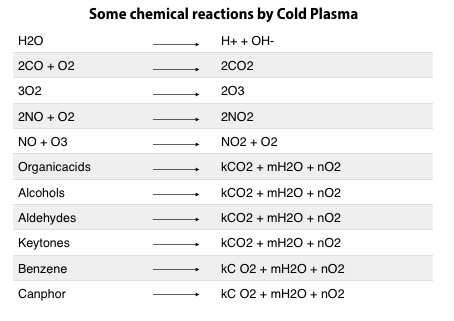
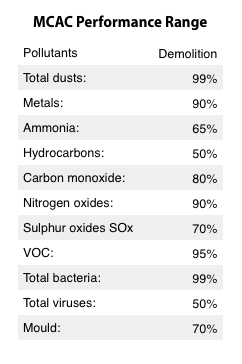
The device uses the Cold Plasma technology which has the biggest effect against bacteria, viruses, dust. See the performance range table below.
The air crosses the plasma step and then goes to the scrubber step. There the air passes through water and the water is enhanced by substances taken off the air and is collected in a tank below. A complex automatic loading of clean water, periodically provide integrated water that is absorbed from the air due to evaporate and purge a portion of that contained in the tank. The purified air come out from the top.
Example: MCAC’s implementation
The Cold Plasma generates by-products like Hydroxyl H and OH, Ozone O3, Oxygen peroxide H2O2 and Nitrogen Monoxide NO. The NO + O3 are converted in NO2 + O2 but as the company has implicated some additional filtration steps then the bad by-products of the cold plasma process are eliminated. For example when NO2+O2 passes through the washing step is converted in Nitrous acid HNO2 because it is soluble in water and remain inside a water tank where becomes Nitrite Salts, so the air comes out clean.
It performs very well with most of the air pollutants. In the table below you can see how effective is with dust particles PMs, Nitrogen Oxide NO2 and Carbon Monoxide CO.
This technology isn’t low-priced but it is affordable for governments and municipalities especially in big cities like Madrid, Milan, Paris, London, etc where air pollution is very high and citizens need desperately clean air.
Fact: The average human during rest processes 11,000 litres of air every day. The image above shows in real scale this fact. Making some basic calculations the average human breathes ±8-11 litres of air per minute. An athlete can breathe more than 150 litres per minute and elite male athlete can breathe even up to 240 litres per minute, so in an hour of hard training 14,400 litres of air will pass through an athlete’s lungs.
We have to make sure that each litres of air is pollutants free such as PMs, CO, NOx, SOx and O3 and especially for athletes that breathe more than 20,000 litres of air per day and the breathings are more deep and can reach deeper regions inside their lungs.
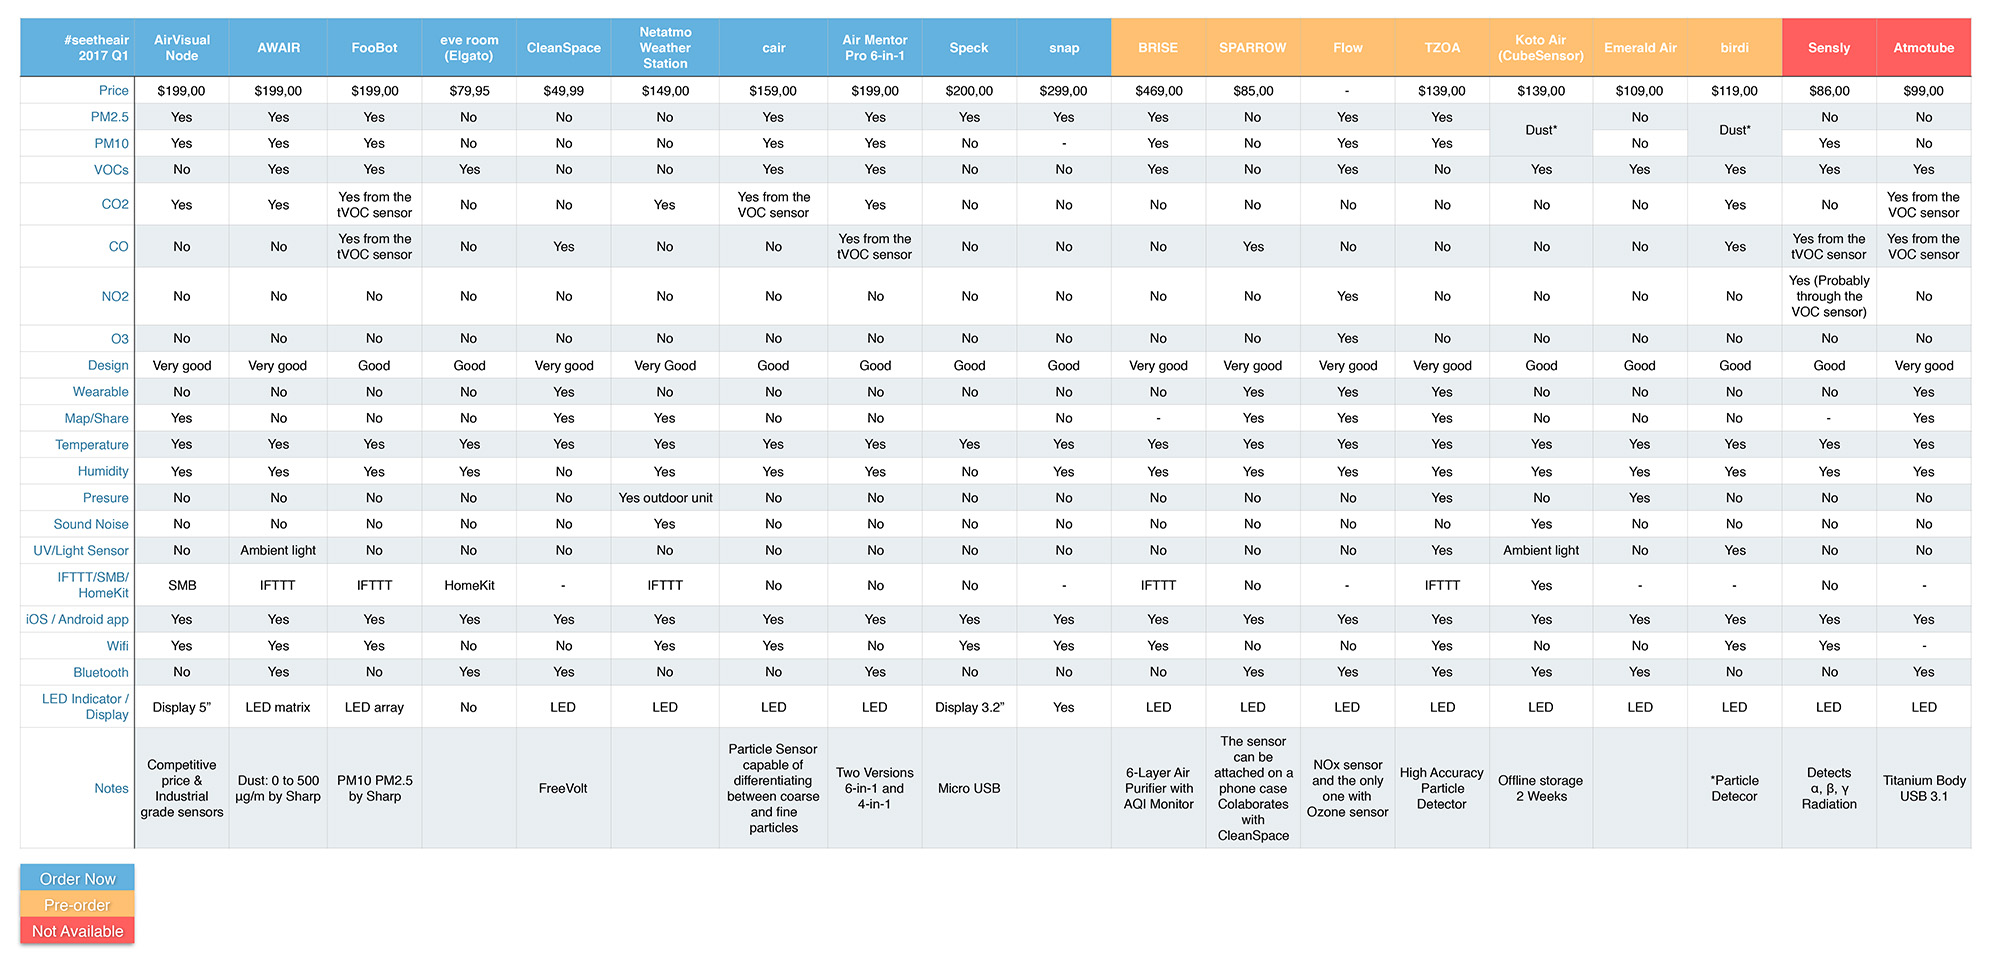
This year the list is much bigger as more companies see the potential of this market. From wearables to home AQI devices are here to assist people’s needs. Remember air pollution is everywhere.
Prices may vary during time.
Some Companies don’t specify on their data sheet if their devices are capable to measure PM2.5 or PM10 and they just mention the word dust.
Some other companies say: Our product goes beyond CO₂ by analyzing substances that directly affect your well-being by measuring VOCs. They aren’t clear if their devices have CO₂ sensor.
Some of the devices are AQI Monitors and Air Purifiers Combo. On this list you can only read the features as an AQI monitor.
The classification of the design between Bad, Good and Very Good is based on the materials (plastic, wood, glass and metal) that they use and the aesthetic on my personal opinion.
Both devices are equipped almost with the same home-environment sensors.
CO2 sensor: Awair | AirVisual Node
Particular Matter sensor: Awair | AirVisual Nod
Temperature sensor: Awair | AirVisual Node
Humidity sensor: Awair | AirVisual Node
VOCs sensor: Awair
Carbon Dioxide:
Both devices have a dedicated sensor for the CO2, they use a different brand but they are equally well. AirVisual Node is equipped with the SenseAir S8 Sensor. Awair is equipped with the Telaire 6703 Sensor. Both are expensive and accurate and both devices display the CO2 in parts per million (ppm) values. They always measure the same values.
Particular Matter:
AirVisual Node uses the AVPM25b sensor which AirVisual own and co-developed. Awair uses a “generic” sensor by Sharp GP2Y10. Sharp’s sensor isn’t accurate at all in my opinion through my experience but the AVPM25b is very good and uses a small fan to draw air inside which produces a low sound noise. Both measure in μg/m³.
Temperature/ Humidity:
I had the devices side by side for a long time and they always had the same indications for temperature and humidity. However the AirVisual Node used to show an exact +10% offset in Humidity measurements, for example when Awair (and two more humidity instruments) indicated RH:51% the AirVisual Node indicated RH:61% and so on, but they updated the firmware and the offset is now fixed.
Volatile Compounds:
Awair is the only device which features a VOC sensor. Some people find value on it so it’s nice to have it if you need it. It measures in ppb. To be honest I don’t trust the VOC sensors in general and you can read the reason on this post: My opinion about VOC Sensors.
Connectivity:
Awair features WiFi and Bluetooth (BT for the initial set up) and they finally fixed the connectivity issue they were running into that caused the device to disconnect from the internet. Awair also features IFTTT, Alexa and Nest connectivity. AirVisual Node features only WiFi but they offer the off-the-grid ability in which the device stores the measurement in a .csv file and you can have access to it via SMB later, read more on the Complete Review: AirVisual Node. The Node is powered and charged via a micro USB port but the Awair uses a connector like the old Nokia phones which is a bit uncommon nowadays.
UI/UX/Design:
Both devices have a unique interface. The Awair allows browsing the air quality history up to a week and the AirVisual Node has an unlimited air quality history. Personally I prefer the charts from the Awair UI which are curved lines, the Node uses columns (question of taste). As a physical device Awair offers a modern with clean lines design and AirVisual Node a futuristic more curved one. Finally the Node has a 5-inch colour display in front which offers a lot of information (Local and/or Remote) and Awair has a dot matrix display which is more discreet.
Conclusion/Suggestions:
All in all both devices are well built in the majority of the sensors. I like both of them they have a great design and great software. I feel that the Node has got some unique features for the advanced users and Awair offers an easy and friendly experience for the average user. Awair please you have to consider allowing the device to function without internet in the future. AirVisual please the app and the widget are missing the value (μg/m³) of the PM2.5, it appears on the device but neither on the app nor the widget except the US/China AQI values.
I left for vacations (New Year) and I had to let my house fully closed during 4 days, so I took a close look on how fast the house alone would be able to recover from the CO2 gas.
As a result it took more than 38 hours to recover from 1276ppm to 450ppm. Normal, but alarming as well. Inside the house there isn’t only CO2 gas but other gasses and VOCs too, as a conclusion gases in general get trapped inside our houses and they don’t “disappear” fast. We have to ventilate our houses frequently.
Been inside the car doesn’t keep you safe from the air pollutants of the street and traffic at least if you don’t own a Tesla Car with Bioweapon Defense Mode activated.
I made a trip from my city Almeria to Malaga and back. The journey was approximately 4h long in total via the highway. The graphs are divided into two pieces. The first one is the trip from Almeria to Malaga and the second piece is the way back. On my way to Malaga the weather was rainy throughout the whole trip which I think worked as an air cleaner because the rain droplets trap PMs and don’t allow them to flow freely in the air. On my way back to Almeria there wasn’t any traffic at all on the road due to late hour of the trip (01:00am-03:00am), so there wasn’t any particular pollution in the air either.
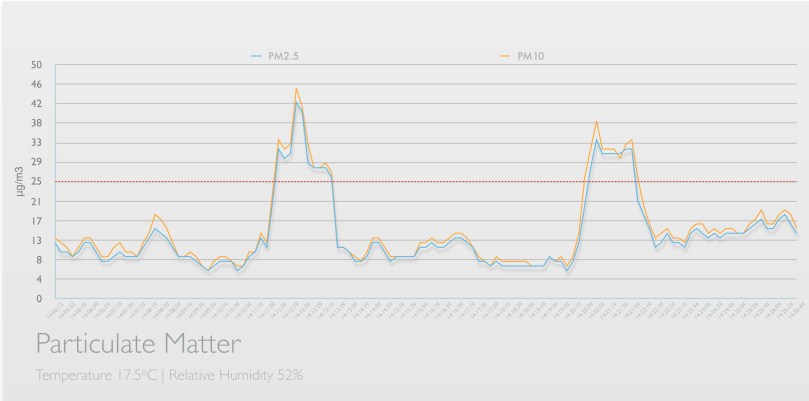
Now let’s see what happens when you drive a car at pick hours at the city center and without raining to settle down air pollutants.
There were two spikes over the recommended limit of 25μg/m3 and both times the car was still waiting behind a conventional bus on the traffic lights and some other cars were around as well.
In conclusion the air quality inside the car will decrease when you drive in busy streets due to Particulate Matter emissions by tyres, burning of fossil fuels in vehicles, asphalt rubber friction etc… Your car has got an air filter remember that you have to replace it and ask your mechanic if there is a better quality filter that you can install.
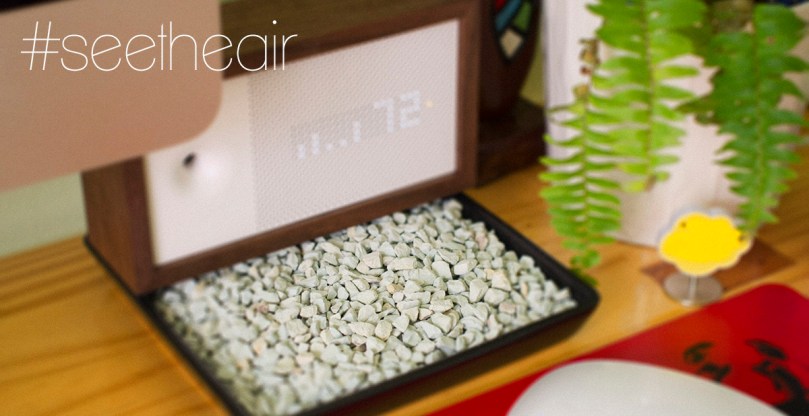
I was doing a research for ways to remove VOCs from the atmosphere without using electronic devices like air purifiers but through passive material. As a result I found about Zeolite Rocks which are claimed that can absorb formaldehyde, ammonia and other VOCs from the air or water passively.
As you may expect I purchased 500gr of small Zeolite Rocks to conduct an experiment. I want to mention here that is hard to find these rocks because they aren’t commercialized, it’s easier to find them as filters for aquarium because in general are used to remove ammonia from the water.
They also claim that the rocks are “rechargeable” by heating them in the oven in 200°C/400°F for 30min they can be used again and again.
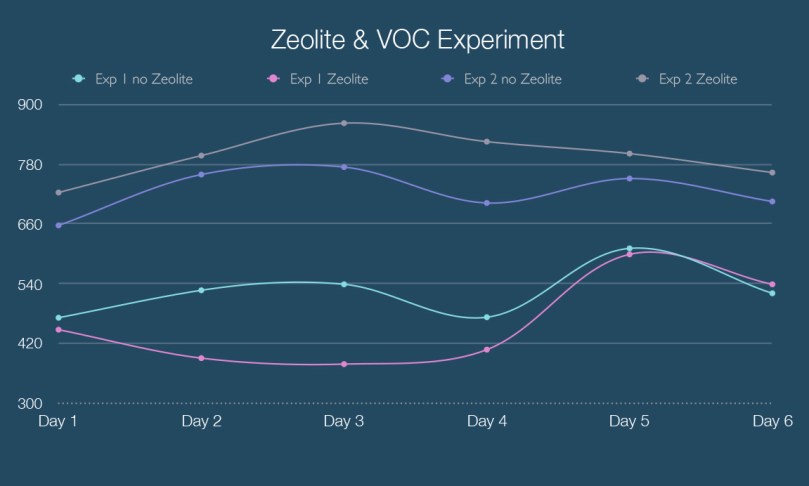
I took daily measurements for 6 days without having the rocks anywhere near the sensor and the average result for the VOCs was 524ppb. After a week I placed under the AQI monitor 400gr of Zeolite Rocks and again I logged the measurements for a week. The average result for a week of VOCs with the rocks is 461ppd. A difference of 63ppb less VOCs.
After that I repeated the experiment, 6 days without rocks and 6 days with rocks but this time I isolated the room and I kept it without ventilation. The values were higher in this case and the rocks seemed like they couldn’t absorb VOCs any more.
In conclusion the rocks may absorb gases but you need a great quantity of rocks to achieve a good result, for example 100ppd less VOCs something which make it hard. Remember by opening the windows for a few minutes you can refresh the air quality immediately in case the outdoor air is in better conditions than the indoor.