Is the AQLI the new AQI?

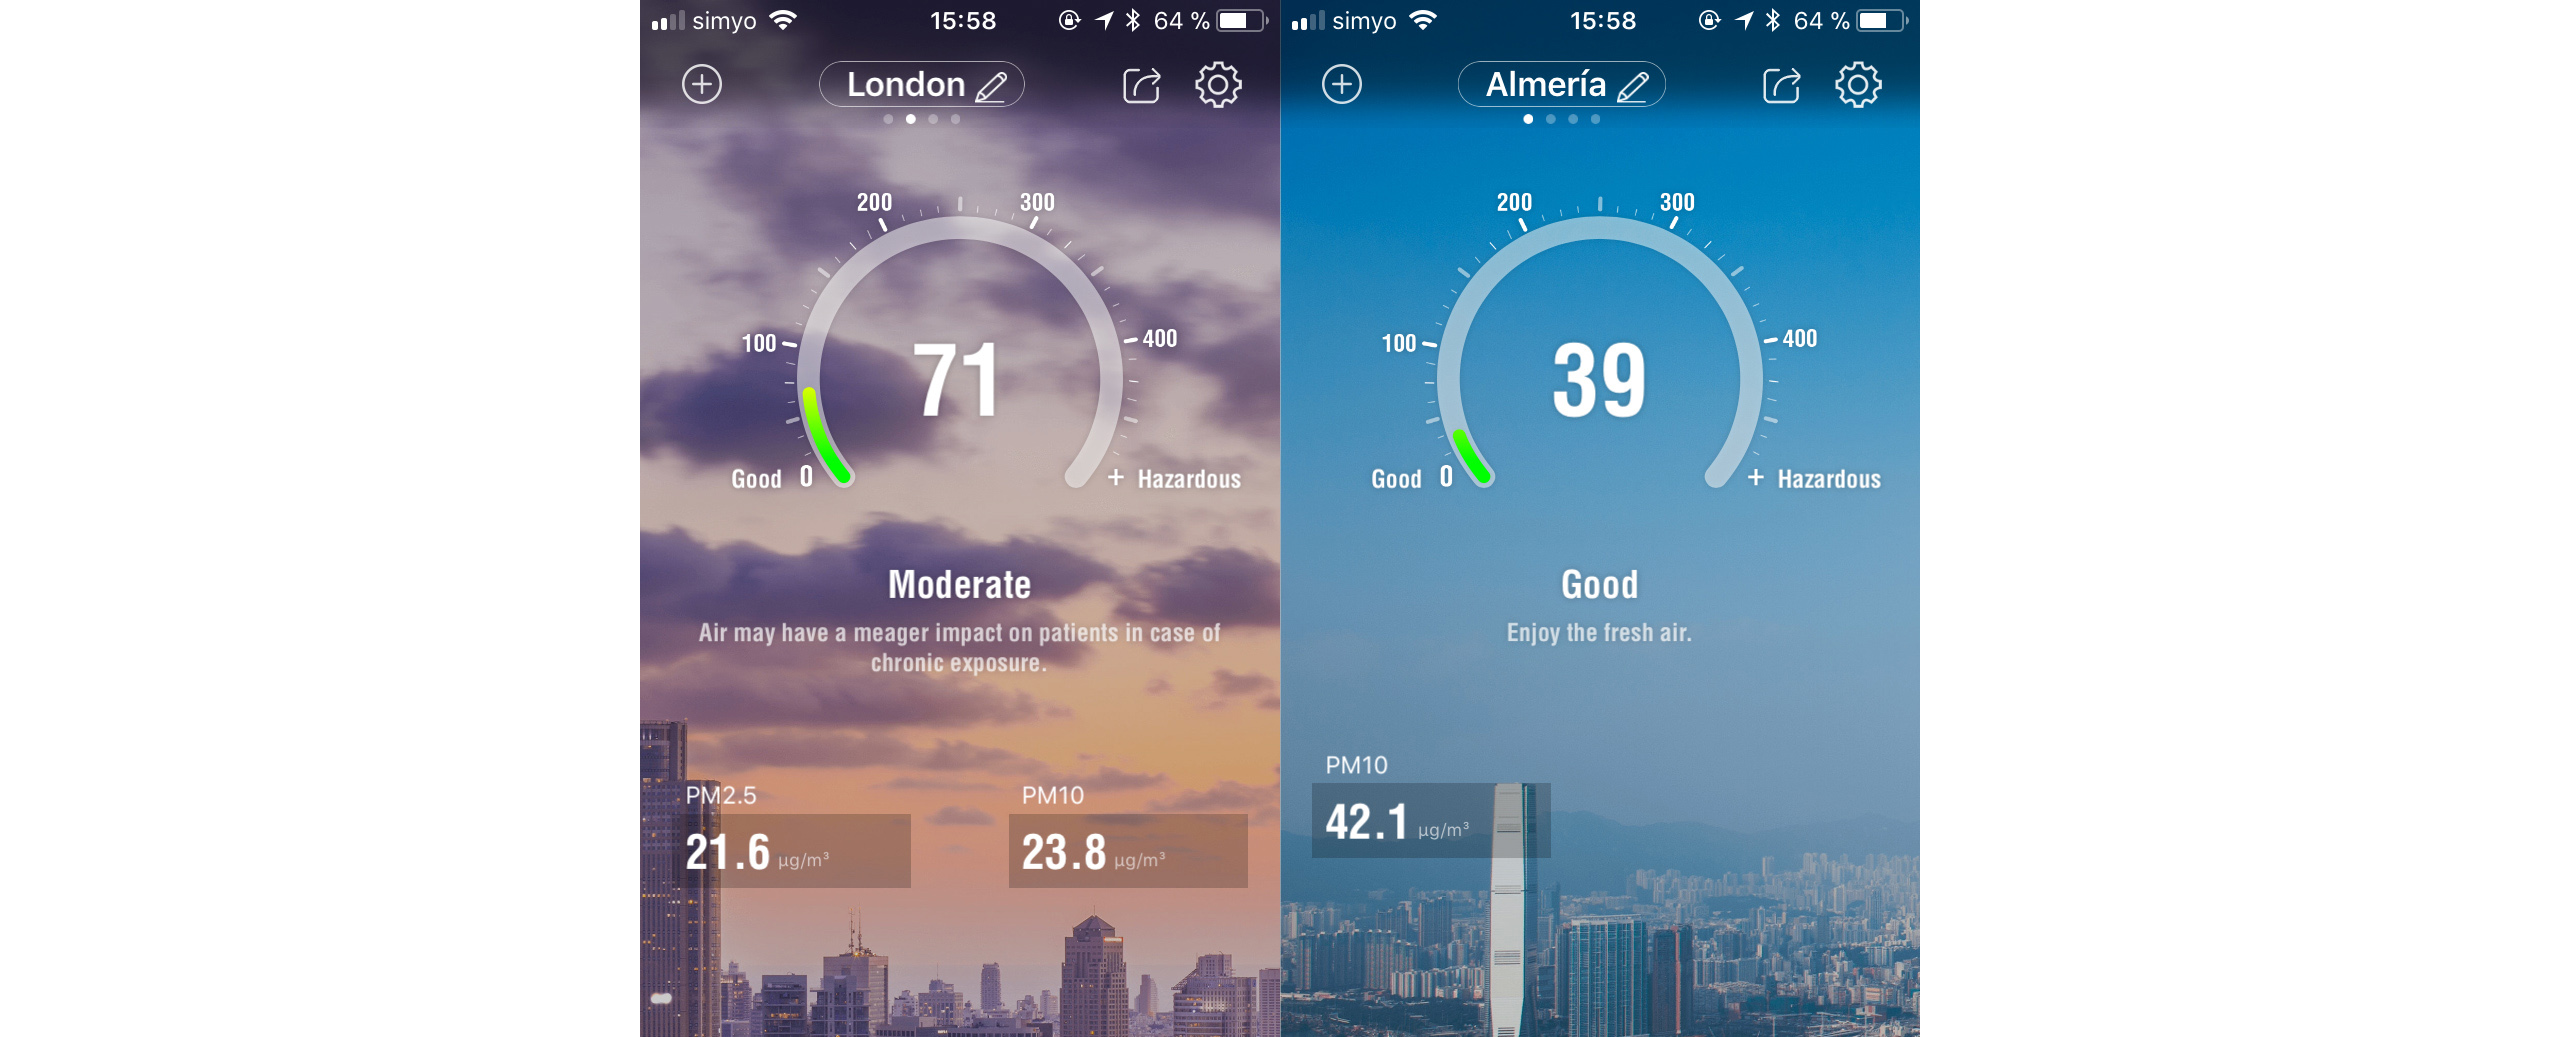
AQI stands for Air Quality Index and it is the number or colour that indicates how good or bad is the air quality in your area. The problem with the AQI is the way each governments calculates the air pollution and what parameters it uses to project this Index number/colour. For example, the USA Environmental Protection Agency (EPA) considers as breakpoint for a “Moderate” NO2 concentration the value of 101μg/m3, but the UK Department for Environment, Food & Rural Affairs (DEFRA) considers as breakpoint for a “Moderate” NO2 concentration the value of 201μg/m3. The difference is huge and the Index changes dramatically for each country and at the end people get confused.  The same rule applies for all the pollutants, PM2.5, SO2, O3, etc… Later they are combined all together to give us the final Index.

AQLI stands for Air Quality Life Index and only take into account the PM2.5 pollution. It is based on the finding that an additional 10μg/m3 of PM2.5 reduces life expectancy by 0.98 years. By combining this finding with satellite PM2.5 measurements around the world, the AQLI provides an insight into the global impacts of particulate pollution in local jurisdictions. The Index also illustrates how air pollution policies can increase life expectancy if pollution levels were reduced to the World Health Organization’s (WHO) safe guideline or existing national air quality standards, or by user-selected percent reductions.

Could the AQLI replace the different AQIs worldwide?

Although it gives a better insight into the impact the air pollution has to our lives, it will not be able to convince people in countries where the impact of air pollution doesn’t translate to high “Life Years Saved” numbers. For example, we can clearly see from the table below that if China adjusts their policies according to the WHO Guideline the population will have a benefit of 2.9 years. However, if Netherlands adjusts their policies according to the WHO Guideline the population will have a benefit of 0.3 years. This is rather a small number and I am afraid people won’t take it as serious in western countries as they should. In my opinion the AQLI has to take into account how our quality of life (not only life expectancy) is affected by the air pollution. We may live longer but sometimes inside hospitals, under expensive insurances and medicines that not everyone can afford even in US, Europe, etc.

AQLI YEARS

Moreover, the data that you see on the table above (extracted from the original document which you can find below) do not reflect the real air quality an individual has been exposed in his a city/town/village. They have created an annual average PM2.5 concentration and the aggregations are population-weighted, which means this map won’t help an individual to understand the air quality in his/her area. For instance, there is a small town in my region called Carboneras, the population is small but there is a coal power plant there (equipped with 48 coal burners). People’s life expectancy from that village won’t reflect on the annual PM2.5 concentration because the populations is small.

Read the paper at https://aqli.epic.uchicago.edu/wp-content/uploads/2018/11/AQLI-Report.111918-2.pdf

Conclusion

I really admire this exceptional work which is done by Michael Greenstone and Qing (Claire) Fan because we need a global way to understand the air pollition and its effects. They have developed a tool which can help to inform local communities and policymakers in Asian countries about the benefits of air pollution policies in very detailed way.

Awair 2nd Edition vs AirVisual vs uRad A3

The battle begins, I am going to dive right into the comparison. In this comparison I am only going to compare the PM2.5 sensors because a good PM2.5 sensors says a lot about the quality of the device. The participants are:

Read More »

Indoor IAQ Monitors 2018Q4

Here are all the available and not IAQ Monitors on the market. This time I included a new row with the Year each device became or will become available.

A PDF version of the table is available here: Comparison AIQ 2018 Q4


comparison air 2018 Q4

  • Prices may vary during time.
  • Some Companies don’t specify on their data sheet if their devices are capable to measure PM2.5 or PM10 and they just mention the word dust.
  • Some other companies say: Our product goes beyond CO₂ by analyzing substances that directly affect your well-being by measuring VOCs. They aren’t clear if their devices have CO₂ sensor.
  • Some of the devices are IAQ Monitors and Air Purifiers Combo. On this list you can only read the features as an IAQ monitor.

Review: Awair 2nd Edition

I love when companies manage to release a second generation of their original product. In this case, Awair released the new Awair 2nd Edition a few months ago.

They clearly have learned a lot and the adjustments they have done and offer with the new version are notable at least hardware-wise. Software-wise the tweaks are small in comparison with the old version but welcome. This can be a good thing because old users can enjoy similar features like the new ones.

Read More »

The Next Air Quality Monitor

There are hundreds of Air Quality monitors out there but still there isn’t a single one designed and built to meet people’s needs and capture the market’s attention, each time they miss something. Companies are missing key functions for a good Air Quality monitor, hardware-wise and software-wise.

After years of experience and countless conversations with users and professionals via email/twitter/skype I know what is missing from the market.

If you are an entrepreneur or a business developer or a company that is planning to develop one more air quality monitor, remember to contact me first because I am going to bring substantial information to your company for the Next Air Quality Monitor.

Handheld AQ Monitor made in China WP6930S

Time-to-time See The Air readers contact me because they want to know if some portable Air Quality monitors made in China worth an investment, so I decided to research and find out which of them is the best. First, I cross checked the features as they were presented online and I noticed that some of them have a laser Particulate Matter PM2.5 sensor, which is good, and some other use an optical one. With that in mind, I purchased the WP6930S.

Read More »

BRISE C200 PM2.5 Efficiency Tests

On the previous article, I presented a new air purifier with an A.I. Engine called BRISE C200. In general, the best way to prove the efficiency of an air purifier is by taking measurements with a respectable 3rd party AQ monitor while there is an air quality issue ongoing inside the room and that is what I did. I used the uRAd A3 Monitor for the measurements and the device was placed near the purifier.

At first, I had set the purifier off on purpose because I didn’t want the A.I. engine to kick in automatically before I was able to register the event. When a PM2.5 spike was registered, as you can see on the picture below from 4μg/m3 to 26μg/m3, I turned on the purifier and the air quality inside the room immediately improved till it returned to the normal PM2.5 concentration and the purifier turned itself off automatically.

AQ-BRISEC200

In the picture below you can see the FC200 4-in-1 Combo filter after one month of usage. The carbon pre-filter has captured PM10 particles, hair, dust and even a little dead spider, which was caught by the purifier’s air flow when it was set on Turbo Mode. After that, we can see the blue anti-bacteria filter and under it the HEPA filter responsable for capturing all PM2.5 particles. Finally, the TiO2 will absorb harmful chemical vapors.

FILTERS C200 BRISE

I wanted to repeat the experiment with the BRISE C200 purifier and a different AQ Monitor in a different room and day, so with the help of the AirVisual AQM I set them up in my bedroom. This time it took 14 min into Turbo Mode to clean the air, the bedroom is a bit bigger. When the purifier achieved a concentration of ±1μg/m3, I turned it off and with the door closed the air inside the room was kept clean, but immediately after I opened the door the air quality was decreased. Below you can see the results.

airvisaul brise

Review: BRISE C200 Air Purifier

It was time to review an air purifier because it is a vital device for those who suffer from air pollution and allergies. The purifier that I am going to review is called BRISE C200. It was first launched in Taiwan in 2017, although the company’s headquarter is in the Netherlands with team members in Germany and Taiwan. I have been following this company since their first steps into the air quality market.

The reason I wanted to review this purifier first is because it is the first air purifier with artificial intelligence aka A.I. and because it combines two devices in one, an air quality monitor and a purifier, obviously.Read More »

17 Air Quality Apps

Not everybody can afford an AQ Monitor or simply not everybody wants to spend money on a AQ Monitor. That’s fine because here are 17 Free/Paid apps for you to check the outdoor air quality in your area. Some of them can notify you when the Air Quality is poor and guide you on breathing cleaner air. Unfortunately some apps don’t support some regions, this is because some developers face difficulties to obtain data from local authorities. (The public air quality stations in my region suck!)

CALIOPE (Free) ♥♥♥

caliope

Caliope is an air quality forecast system for Spain, developed at Earth Sciences Department of the Barcelona Supercomputing Center – National Supercomputing Center (BSC-CNS). The app supports all Spanish regions and the website version supports most European countries. Available data O3, NO2, SO2, PM10 and PM2.5. Maps and Pollutants. The website is available in English and Spanish.

EPA AIRNow (Free) ♥

EPA

The EPA AIRNow was designed by the United States Environmental Protection Agency. Although the agency has access to all the US AQ stations and a huge amount of data, the app is plain and with a very poor design. There is nothing special about this app. Even the icons are pixelated. They should be ashamed, the app looks like an internet page from 1999.

AirVisual (Free) ♥♥♥♥♥

airvisual

AirVisual provides a free app for their device Node/Pro but it also works without it.  You can have access on a huge amount of outdoor AQ Stations around the globe. With a history browsing for all the pollutants, maps, ranking and news. The data are from public stations but also from their devices around the globe.

Wunderground (ads) ♥♥♥♥

Wunderground

Wunderground is basically an advance weather forecast app but they also provide air pollution data if you are lucky enough, which means depending the weather station they use to get the data for your area. If the weather station in your area has air quality sensors then they will provide you with the data.

Plume (Free) ♥♥♥♥

plume

Plume Labs has design this app to help people avoid air pollution. Their app offers an air pollution forecast. It is a simple but a complete app. You will see an Air Index at the home screen, weather conditions and the activities that they recommend you to do depending the air quality at that time. They use public AQ stations but they will also combine the data from their devices in the near future. It supports notifications.

CleanSpace (Free) ♥♥♥

cleanspace

CleanSpace focuses on Carbon Monoxide air pollution. On the home screen you can see the “current” air pollution from your device but if you don’t have a device you can also browser their air pollution map. They also provide some weather data from the local weather station. A bit limited on the pollutants.

Air Quality (Free) ♥♥♥♥

Air Quality

The app exist on the app store with 2 different icons but the same name, by the same developer and the same interface. It is a very nice app with plenty of data. The app has some nice animations and a clean design.

Airpocalypse (Free) ♥♥

Airpocalypse

This app is for the Chinese citizens because only supports Chinese cities. Super Clean design and some funny icons and quotes.

BreezoMeter (Free) ♥♥♥

BreezoMeter

BreezoMeter will help you get to the point of the air quality immediately. They support a map but the elephant will let you know if your outdoor air quality is safe and it will give you some advice. It will also tell you which is the dominant pollutant in your area.

Netatmo (Free) ♥♥

Netatmo

Netatmo is mainly a weather forecast app but it also provides some simple air quality data. Nothing fancy regarding the air data.

Air Bubbles (Free) ♥♥

AirBubbles

The Air Bubbles app indicates the air quality with colour-coded bubbles. Not many info available.

Air Matters (ads) ♥♥♥♥♥

air matters

Air Matters provides air pollution data, weather data and allergy data. If you suffer from allergies from a specific tree or plant like mugwort or olive trees etc, it will provide you with all the useful data. History browsing is also available and maps. Very clean and good design.

Awair (Free) ♥♥

awair

Awair has a small and basic tab with the outdoor air quality and weather conditions which allows you to compare them with the indoor air quality in case you  have their device.

Air Checker (ads) ♥

Air Checker

Air Checker is very simple, you just type your city and it tells you the air quality plus the pollutants. I compared the data with others and they didn’t correlate at all. So I am not very sure about the accuracy.

Aerium (Paid) ♥♥♥

aerium

Aerium is a weather forecast app but if you upgrade the free app it will also give you air quality info.

Kaiterra (Free) ♥♥♥

Kaiterra

Kaiterra is a free app for the Laser Egg 2 but it also provides outdoor air quality data. Simple design with an AQI and a histogram for the air pollutants.

Foobot (Free) ♥


foobot

Foobot has a basic tab with the outdoor air quality index for the outdoor location of the indoor device.

Air Quality Monitors – Comparison 2017 Q4

Holidays are coming and people are searching for gifts or for ways to protect themselves from air pollution. A great way to start 2018 is by seeing the air around you. Once more new companies offer more choices to the costumers and the old ones offer mature products through solid updates. On this update I have removed the Design row and I have added the Application Programming Interface API row, for those who want to know if the companies support this feature. Click on the image and download the PDF document.

comparison air 2017 Q4


  • Prices may vary during time.
  • Some Companies don’t specify on their data sheet if their devices are capable to measure PM2.5 or PM10 and they just mention the word dust.
  • Some other companies say: Our product goes beyond CO₂ by analyzing substances that directly affect your well-being by measuring VOCs. They aren’t clear if their devices have CO₂ sensor.
  • Some of the devices are AQI Monitors and Air Purifiers Combo. On this list you can only read the features as an AQI monitor.