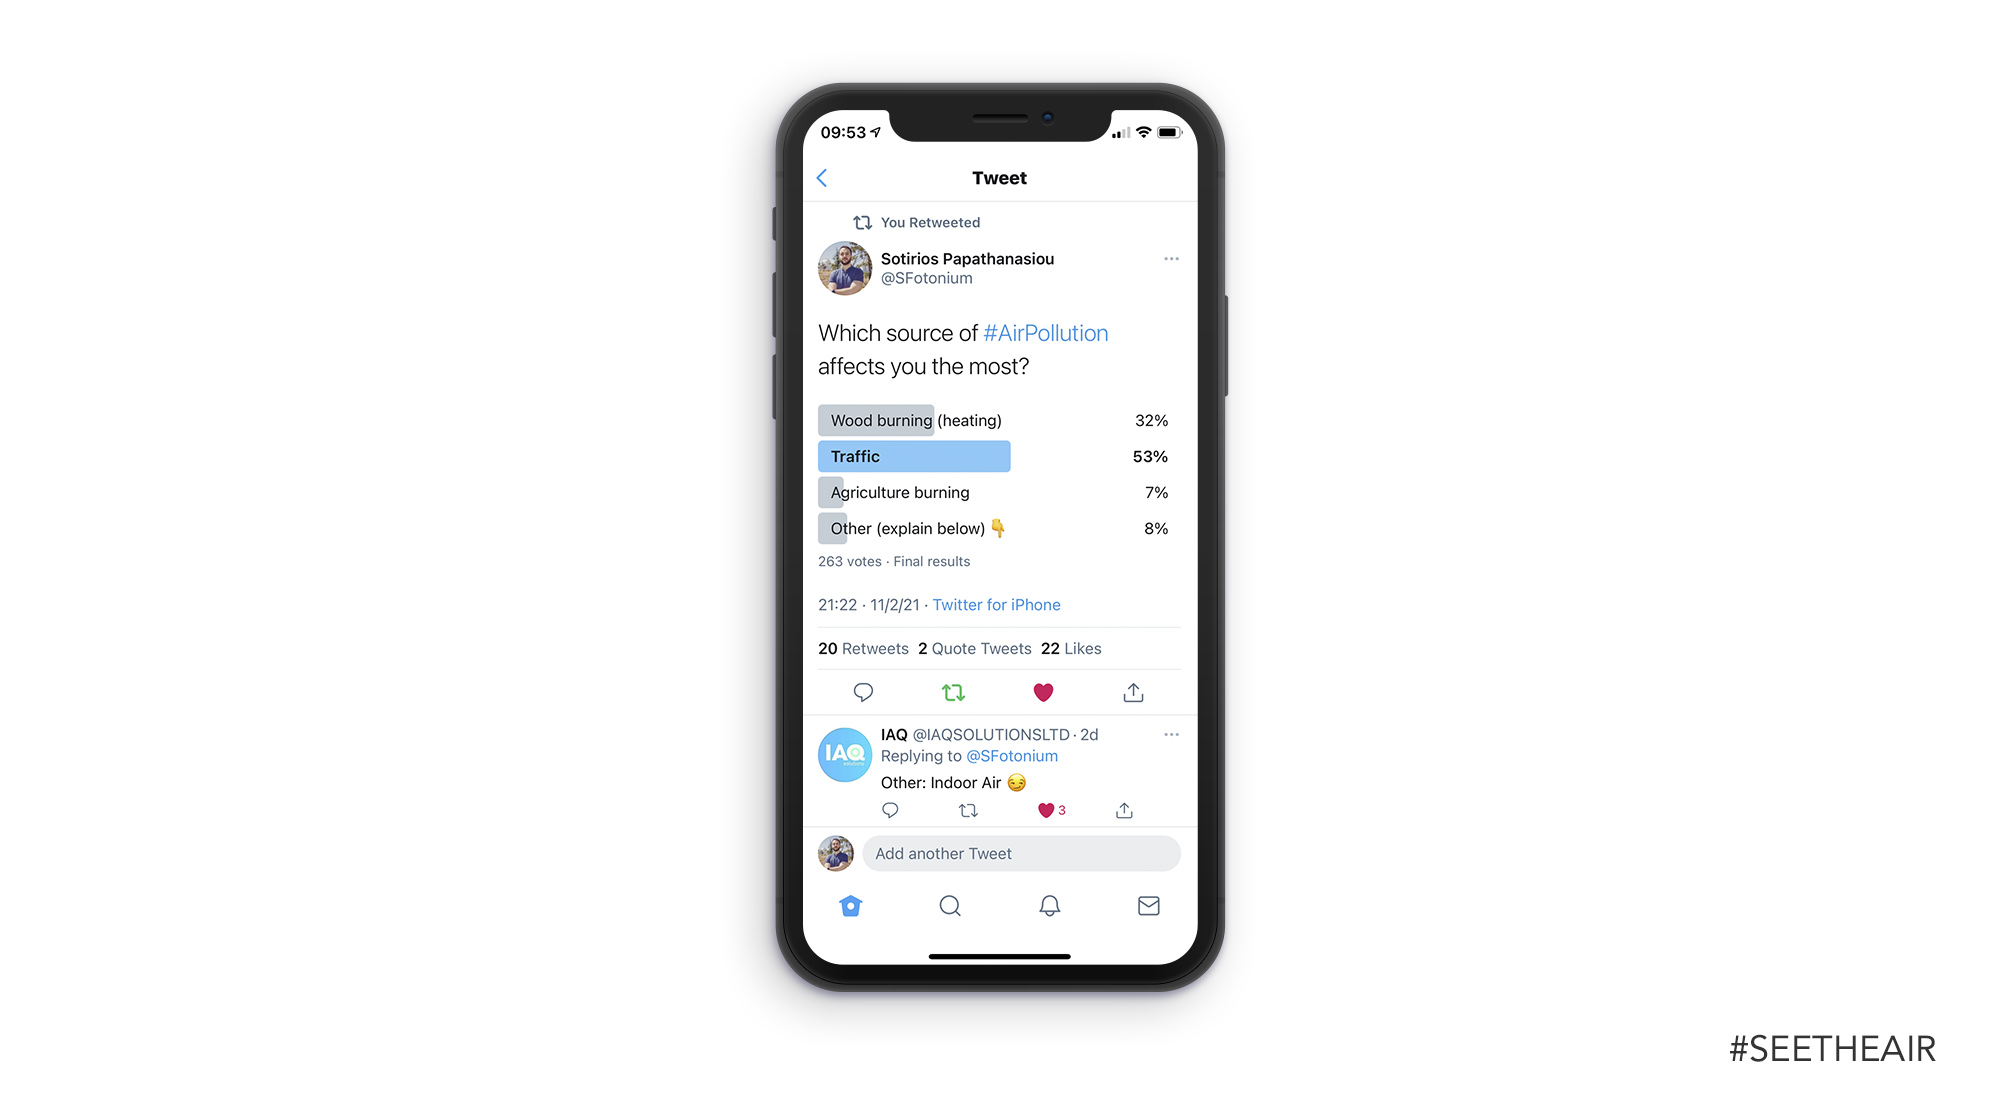
Last week I started a brief poll on Twitter because I wanted to obtain feedback from the community. The subject was simple “Which source of #AirPollution affects you the most?”
263 people responded and unfortunately, I can’t say that the results surprise me. Vehicle traffic was voted as number #1 source of air pollution with a massive 53% and it was followed by 32% wood burning for heating like wood-burning stoves, fireplaces, etc. 7% of the users voted that agriculture is the source of air pollution in their communities and an 8% voted other.
I would like to comment about each category individually, but first of all, I would like to make something clear. All sources are equally important, I don’t rank them from most to least important but I classify them based on what people think is the source in their community, and it varies a lot.
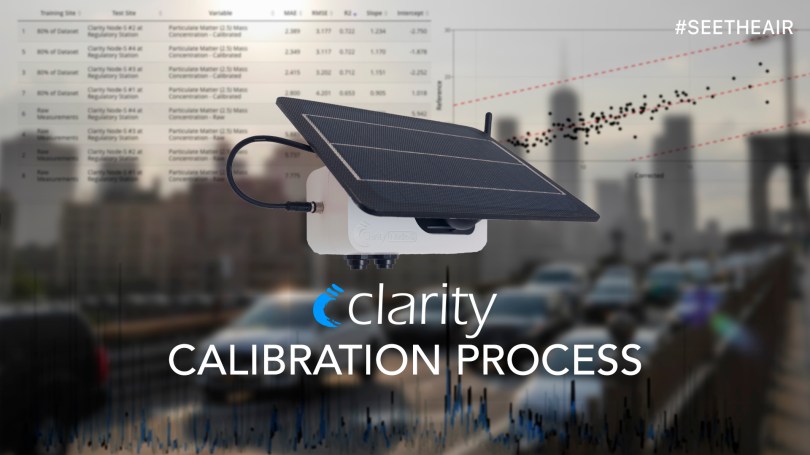
When you use low-cost monitors for professional reasons, you need to calibrate them in order to obtain the best possible measurements. This process makes data less vulnerable to environmental conditions and more valuable to scientists and policymakers.
Clarity takes this process really seriously, and they dedicate a lot of resources to making sure their devices will measure accurate data (for more on how to assess air quality sensor accuracy, see this blog). I ask Clarity to perform a remote calibration on my Node-S and guide me through the entire the process.
I have discovered something interesting during that process about the local air quality station.
As you may already know from my previous articles, my local air quality station ES1393A is placed inside a park and it is almost surrounded by trees. Trees act as a barrier, and they block pollutants from reaching the monitors. The Clarity team told me that this was an especially complicated calibration. I suspect it has to do with the location of the station and how trees may interact with low-cost sensors.
The type of trees in my city is a variation of a ficus called ficus retusa l. var nitida. These trees release a resin from their leaves which can create interference to the low-cost sensors that do not have a filter to keep them out as the scientific-grade monitors do. Most outdoor scientific-grade monitors come with a debris screen inlet or an Inlet Heater which may capture the resin from the trees.
The problem is not the trees but the location of the air quality station that shouldn’t have been there.
In today’s marketplace, there are many ambient air quality monitors capable of measuring multiple environmental parameters and pollutants in real-time. However, air quality monitors aren’t useful unless they are paired with an intelligent software platform in order to extrapolate the information and make it serviceable to operators and communities.
Envirosuite has succeeded in embedded 30+ years or experience working with complex air quality and meteorology challenges directly into an advanced software platform. Users can make operational decisions based on insights from real-time air quality data and emissions modeling. Furthermore, they can identify the likely sources of air quality pollution from past incidents.
The platform is currently used by over 500 industrial operations such as mines, oil refineries, maritime ports, construction sites but also for municipal authorities in cities. Noise management capabilities are also used at 200 of the world’s major airports.
Key modules and their functionalities
Envirosuite does just that and it is a global leader in Environmental Intelligence, using proprietary technology and real-time localized data to help industries grow sustainably and communities to thrive. The platform integrates with pre-existing monitoring devices that are capturing data on multiple air quality parameters. It is offered as SaaS (software-as-a-service) subscription supported by AWS cloud technology and is segmented into modular solutions for to assist with specific air quality challenges.
After almost two months of asking local schools for permission to install air quality monitors in their classrooms, on the 4th of December, a local school decided to grant me access.
In my city, Almeria, Spain, there are about 110 schools. I didn’t apply to all of them because each time I managed to find a way to contact them, I had to arrange a meeting in order to explain to them what I wanted to do, and all this process takes time. I managed to contact nine schools.
For this study, schools didn’t have to pay anything, so money wasn’t the issue for their refusal. They were worried about what will happen if the results were disappointing and negative. I tried to explain to them that the aim of the study is to understand what is going on in the classroom, in real conditions, with real students. I don’t want to discredit the school either the local authorities that manage the budget for the school. For this reason, I will keep the name of the school private.
Monitors
The monitors that I have installed for the study are made by Airthings. There are two Wave Plus, which include a CO2 sensor by Senseair. The sensor is called Sunrise, and it is an ultra-low-power, high precision NDIR sensor. Accuracy (CO2) ±30 ppm ±3% of reading. Finally, it features a self-correction system that allows them to auto-calibrate every 180 hours. I also have included a Wave mini monitor in the teacher’s office room.
Have you ever wondered if the gases we produce as humans are toxic to those who live with us?
It is a taboo but I think we all have thought about it at one moment in our lives. Scientifically known as flatus but commonly known as a fart, many of us even use funny expressions to cope with this uncomfortable situation they create like Acid-rain maker, After the thunder comes the rain, Baking brownies, Death Breath, Fire a stink torpedo, pass the gas, etc…
Let’s take a step back and analyze the chemical composition of a flatus. More than 99% of the volume of flatus is composed of non-smelly gases. These include oxygen (O2), nitrogen (N), carbon dioxide (CO2) hydrogen (H) and methane (CH4), keep in mind, methane is a colorless, odorless gas and nitrogen is not produced in the gut, but it is a component of environmental air. The remaining trace (<1% volume) compounds give flatus its smell which comes from a combination of volatile sulfur compounds. Hydrogen sulfide (H₂S), methyl mercaptan (CH4S), dimethyl sulfide (C2H6S), dimethyl disulfide (C2H6S2), and dimethyl trisulfide (C2H6S3).Read More »
There are a few things you can do to reduce air pollution indoors like keeping things tight and clean, not smoking, using exhaust fans when you cook, and ventilating the rooms, but at the end of the day if the air pollution comes from outside sources then you need to take drastic measures and there is only one solution, investing in an air purifier.
There are many air purifiers on the market for all types of budgets but you shouldn’t expect a cheap air purifier to offer the same features and purification results as a high-end purifier. By the way, air cleaners and air purifiers are the same things.
BRISE C360 is a high-end purifier capable of purifying up to 95 m2 or 1022 ft2 room and rated CADR at 390 m3/hr or 230CFM. It is recommended for medium size rooms and it packs a ton of features.
In a previous post, I presented Airthinx IAQ for Homeowners and how an advanced AQ monitor can be used for indoor environmental monitoring. In this post, we will explore how we can use the same monitor but in business environments (offices, industrial buildings, food supply chains, etc).
We will focus on the tools present in the dashboard as it is one of the best dashboards you will find in the market, and we will learn how to get the most out of it.
Let’s begin with the Dashboard – Home. Here we can create various types of widgets and arrange them according to our preference. First, you can see that I have created a column with all the current measurements with small graphs of the environmental parameters. Right next to it, I always watch for the general AQ, PM2.5, and Humidity. Below I have more widgets with other graphs and values that I want to have a glance.
Dashboard – Home
Next, we can see the Map tab. Here we can locate all the available monitors in a high precision as the monitors come with a GPS module, however, we will see later that we can manually set the location of the device.
Globally, climate change has driven many catastrophic events like the huge wildfires in Australia and on the USA west coast. More and more people reached my blog to collect information about which Air Quality Monitor should invest in and which app should they download to get information about the air quality in their area.
Here are the TOP 6 Air Quality Index Apps that have helped me and others see the air, and they are free.
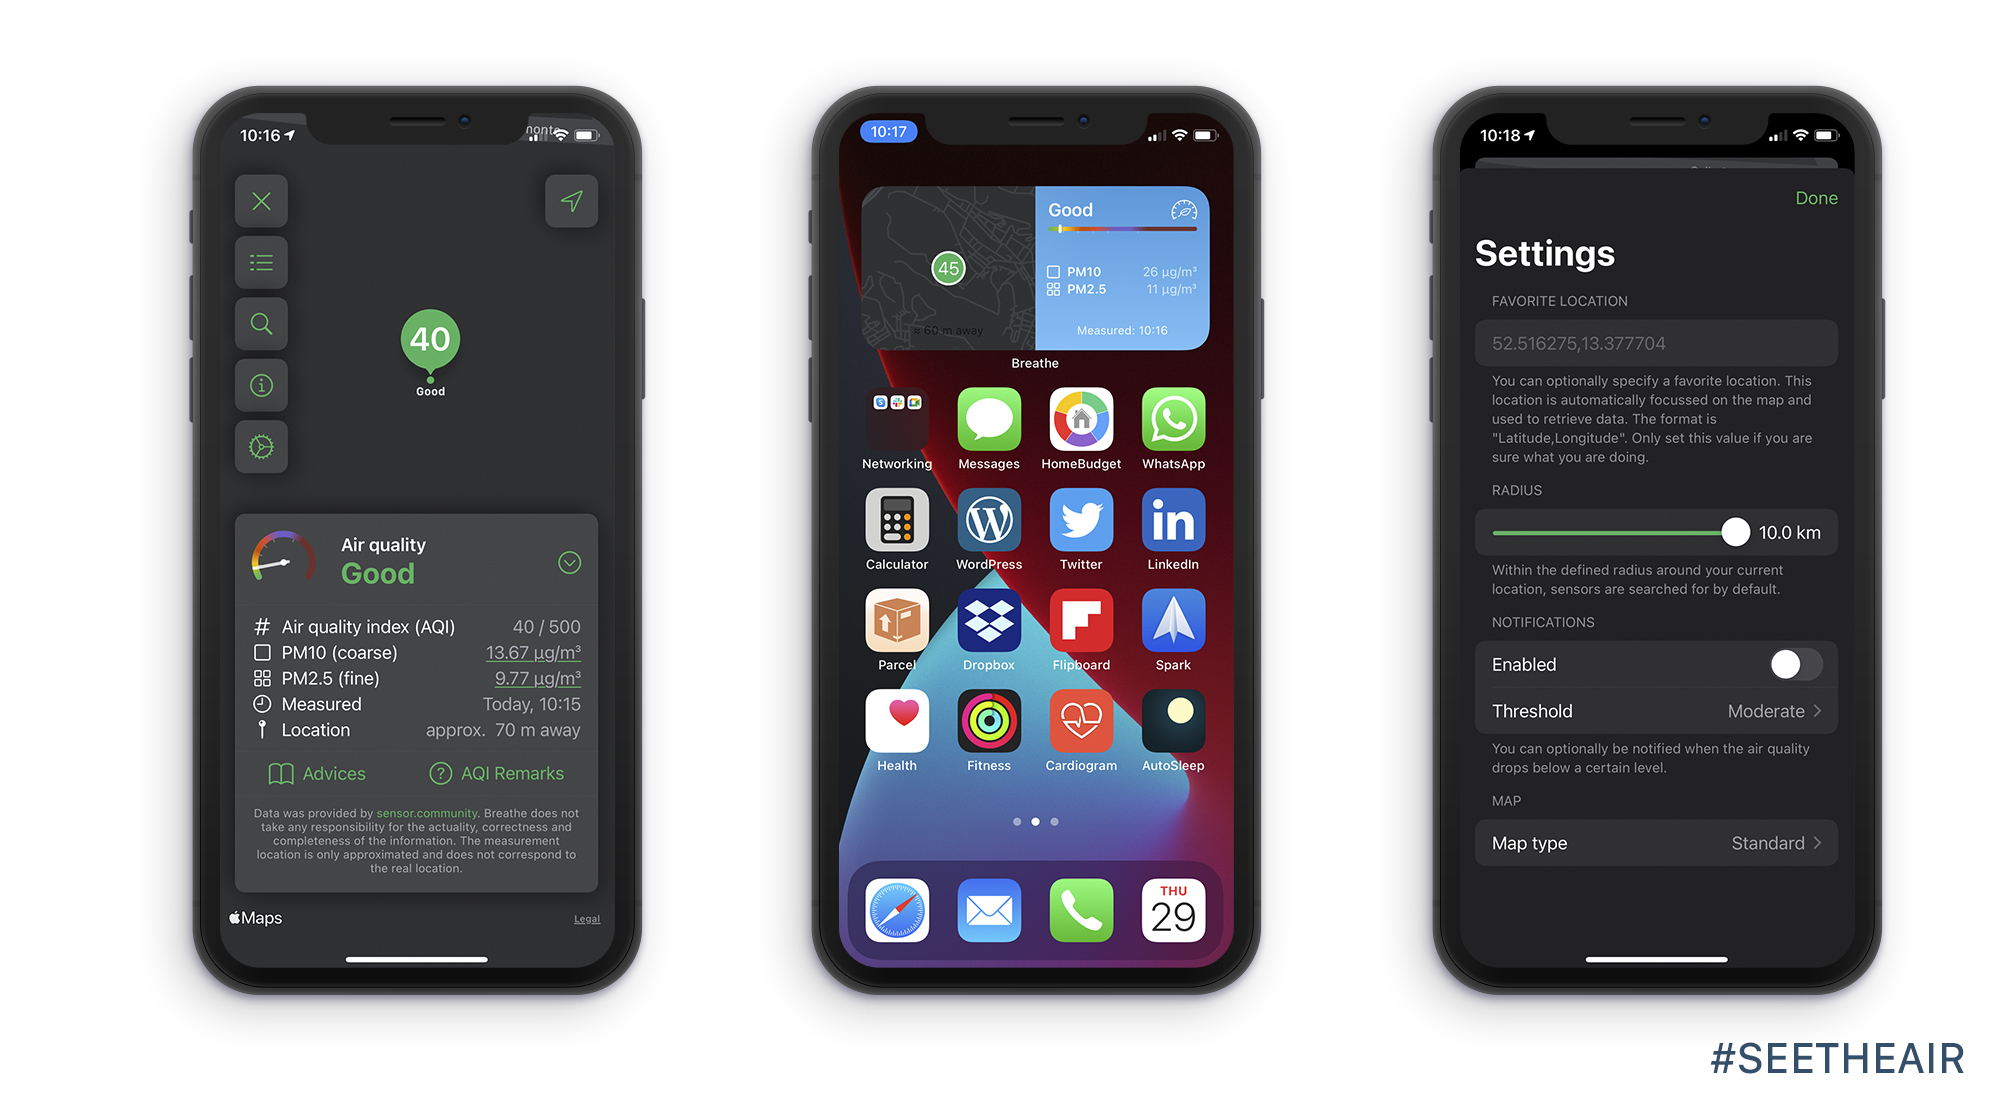
Breathe is a great app for European citizens as it will pull data from the Sensor Community (formerly known as Luftdaten) server and will inform you in an instant about the Air Quality near you. You don’t have to own a monitor as long as there is one available in a radius of 10Km, and in case there are many monitors then it will pull data from the nearest from you. Thanks to the new update, it supports iOS 14 Widgets so you don’t even need to launch the app anymore, just place a tile into your home screen and you are ready.
Local Haze is another great app similar to the Breathe, but it combines information from many sources including the Sensor Community with over 12,000 sensors, PupleAir, and uRad Smoggies. Also, it is available globally. You can choose your favorite monitor, and it also provides the confidence rating, that way we know which measurement to trust more.
BreezoMeter is the app with the most experience in the field of air quality, as the company behind it is leading the industry. Apart from air pollution data, it offers a pollen forecast for those who suffer from seasonal allergies. It uses its propitiatory AQI algorithm called BAQI to give a better insight of the air pollution in your area. Finally, it offers an air quality forecast for up to 6 hours.
Plume Labs is another app with great experience in the field of air quality. It also uses a propitiatory AQI algorithm called PAQI but the company allows users to switch between one of the major AQI algorithms like US EPA AQI, Europe CAQI, China AQI, and Abu Dhabi ADAQI. Another feature that distinguishes Plume Labs is the air quality forecast for up to 4 days. Finally, it supports dark mode.
Although Airly app was designed to support the Airly air quality monitors, it also supports PupleAir monitors and EPA stations and it is powered by Dark Sky service which was recently bought by Apple Inc. It supports dark mode and it is compatible with the US EPA AQI and the European AQI CAQI. Very fast responding app and visually pleasing.
Live Air (formerly known as Kaiterra Global Air Quality) is designed as a host app for the air quality monitors of the company (Kaiterra Laser Egg series). However, the company also focuses on ambient air quality data, and with the latest update, they have managed to combine both sources of air quality information (indoor and outdoor) elegantly.
There is an enormous demand for air quality monitors in cities near forests that are susceptible to wildfires. Climate change has driven huge increases in wildfire area burned over the past few decades, and air quality data can help us protect public health more than ever.
Watch out! Wildfires are not the only source of air pollution in cities. Urban lifestyle with huge diesel/petrol SUVs and delivery trucks moving all around the city all day long emit huge amounts of toxic pollutants (NO2, CO, UFP, etc…) and during winter season wood stoves emit extra 12 times more PM2.5 pollution into the air we all breathe as a result they create an unhealthy environment for all.
Airly is an aspiring company that tries to empower individuals and communities with knowledge about the air they breathe by offering three different monitors that will meet the needs of a different situation. The Airly PM with is the basic version and measures particulate matter PM10, PM2.5, and PM1.0, the Airly PM + Gas (NO2 + O3), and finally, the Airly PM + Gas (SO2 + CO).
For this review, I will present to you the Airly PM + Gas (NO2 + O3) as I believe it represents better the urban environments free from industrial sites. In my city, the number one pollutant is ground level ozone as there is a huge production and transportation of vegetables and fruit all around Spain and Europe and plenty of sunlight.
Keep in mind, ground ozone forms from the interaction of nitrogen dioxide and some other pollutants with UV radiation from the sunlight.