
When you use low-cost monitors for professional reasons, you need to calibrate them in order to obtain the best possible measurements. This process makes data less vulnerable to environmental conditions and more valuable to scientists and policymakers.
Clarity takes this process really seriously, and they dedicate a lot of resources to making sure their devices will measure accurate data (for more on how to assess air quality sensor accuracy, see this blog). I ask Clarity to perform a remote calibration on my Node-S and guide me through the entire the process.
I have discovered something interesting during that process about the local air quality station.
As you may already know from my previous articles, my local air quality station ES1393A is placed inside a park and it is almost surrounded by trees. Trees act as a barrier, and they block pollutants from reaching the monitors. The Clarity team told me that this was an especially complicated calibration. I suspect it has to do with the location of the station and how trees may interact with low-cost sensors.
The type of trees in my city is a variation of a ficus called ficus retusa l. var nitida. These trees release a resin from their leaves which can create interference to the low-cost sensors that do not have a filter to keep them out as the scientific-grade monitors do. Most outdoor scientific-grade monitors come with a debris screen inlet or an Inlet Heater which may capture the resin from the trees.
The problem is not the trees but the location of the air quality station that shouldn’t have been there.
The Calibration
Clarity’s process for PM2.5 and NO2 calibration is similar.
- Each combination of features are evaluated on 80% of the test data and with 10-fold cross validation, repeated 5 times
- Select model based on highest R2 of 10-fold cross validation, repeated 5 times exercise
- Remaining 20% used to independently evaluate model performance
Here is an example of what the raw data from the reference station and the Clarity Node-S looked side-by-side on a particular day back in August 2020. You can also see the results from the calibration.
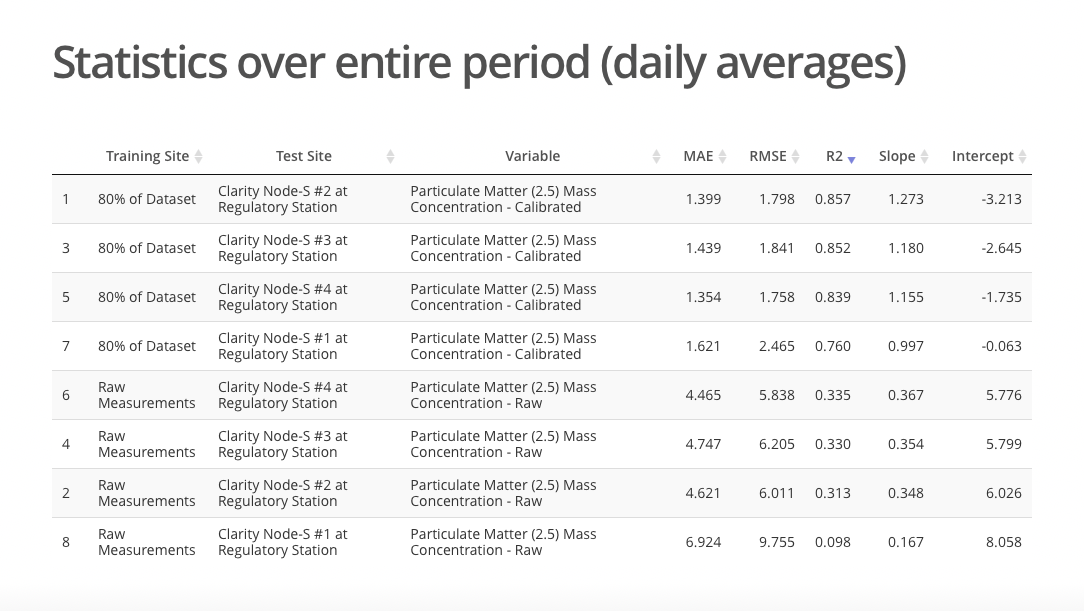
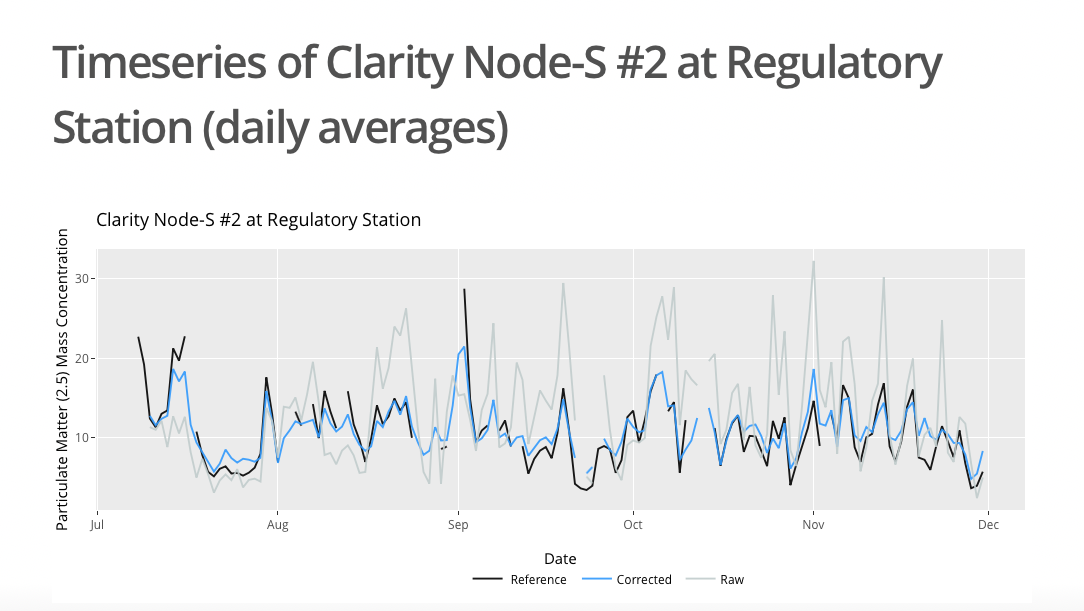
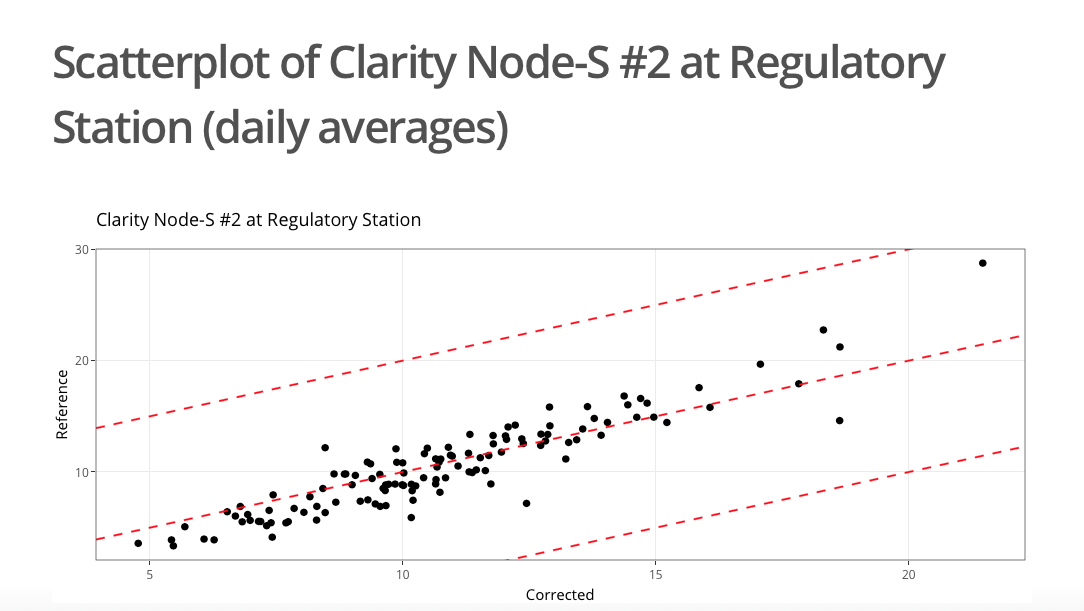
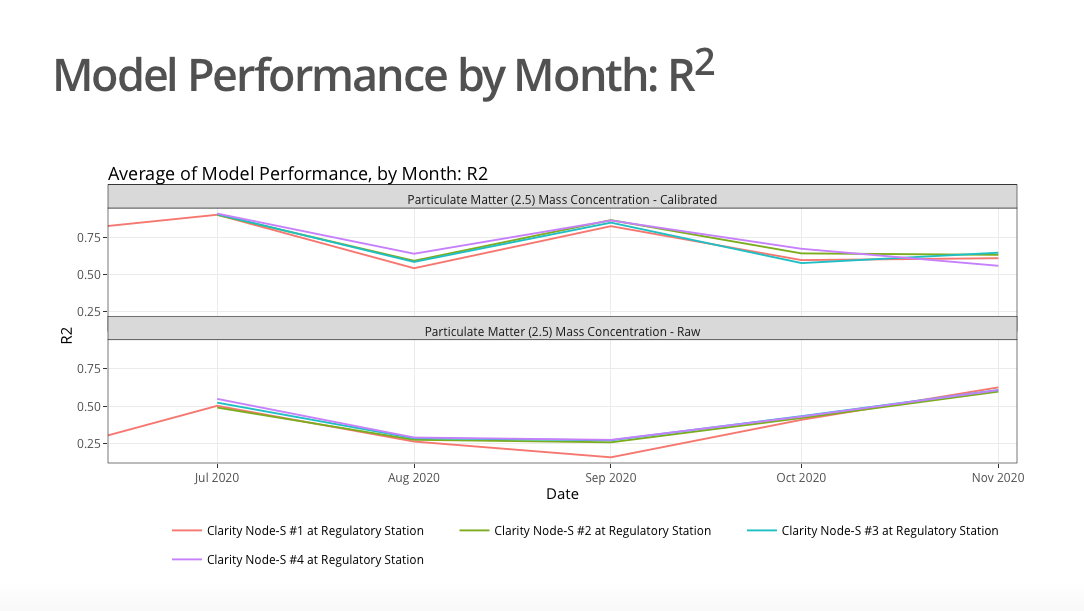
The Clarity team was able to achieve very good r2 calibration results through rigorous calibration methods. The calibrations improved accuracy so significantly that it is almost hard to believe the calibrated dataset was a function of the raw data from the same sensor. Again, I want to point out that the Node-S likely would have achieved better raw r2 correlation against the reference monitor if there wasn’t any interference from the trees.
Conclusion
In my humble opinion, it took a lot of courage for the Clarity team to calibrate the data. If I were in their position, I would have asked for a better-situated reference monitor. However, in some situations, you have to work with what you have. I think a better job must be done by the local AQ authorities because it is time to take air quality more seriously and not to be afraid of sharing data with citizens.
In the UK, the Breathe London project has selected to deploy more than 100 Node-S all over the city of London. This is an approach that many cities could adopt in order to maximize the ROI of their air quality management dollars/euros/pounds. Economically speaking, having 100 low-cost monitors all over the city is an equivalent cost to having 1 to 2 reference stations in just one or two places in a city. Which one will be able to serve more citizens with better spatial coverage and with real-time data? Of course, the AQ network of low-cost monitors.
Discover more from See The Air
Subscribe to get the latest posts sent to your email.
