Air Quality Adaptive Information (AQAI)

Apple iOS 14 has brought many new features to phones and tablets. For the first time, I enrolled in the beta versions of the operating system for the iPhone just because I wanted to explore the user experience (UX) of the widgets.

Long story short, I really loved them, especially the weather widget because of how intuitive it is about the information that it displays. Generally, we are accustomed to the static widgets that they only update the information every 10 minutes and that’s all, but what Apple did with the weather widget was phenomenal. Depending on the time of the day it is able to display the most important information for users to read and make appropriate decisions.

During the day, you can see the current temperature and weather forecast for the following 6 hours, plus the highest and lowest temperature of the day. However, during the night, it makes a short suggestion about the following day, for example, Warmer tomorrow with a high of 29ºC. It is fantastic because you can plan the day ahead. I call this feature Adaptive Information, and this is what I will value as a user from an air quality monitor or and AQ app.

iOS 14: Left Day | Right Night
Read More »

Things no one talks about: Flatulence and Indoor Air Quality

Have you ever wondered if the gases we produce as humans are toxic to those who live with us?

It is a taboo but I think we all have thought about it at one moment in our lives. Scientifically known as flatus but commonly known as a fart, many of us even use funny expressions to cope with this uncomfortable situation they create like Acid-rain maker, After the thunder comes the rain, Baking brownies, Death Breath, Fire a stink torpedo, pass the gas, etc…

Let’s take a step back and analyze the chemical composition of a flatus. More than 99% of the volume of flatus is composed of non-smelly gases. These include oxygen (O2), nitrogen (N), carbon dioxide (CO2) hydrogen (H) and methane (CH4), keep in mind, methane is a colorless, odorless gas and nitrogen is not produced in the gut, but it is a component of environmental air. The remaining trace (<1% volume) compounds give flatus its smell which comes from a combination of volatile sulfur compounds. Hydrogen sulfide (H₂S), methyl mercaptan (CH4S), dimethyl sulfide (C2H6S), dimethyl disulfide (C2H6S2), and dimethyl trisulfide (C2H6S3).Read More »

Review: BRISE C360 Air Purifier

There are a few things you can do to reduce air pollution indoors like keeping things tight and clean, not smoking, using exhaust fans when you cook, and ventilating the rooms, but at the end of the day if the air pollution comes from outside sources then you need to take drastic measures and there is only one solution, investing in an air purifier.

There are many air purifiers on the market for all types of budgets but you shouldn’t expect a cheap air purifier to offer the same features and purification results as a high-end purifier. By the way, air cleaners and air purifiers are the same things.

BRISE C360 is a high-end purifier capable of purifying up to 95 m2 or 1022 ft2 room and rated CADR at 390 m3/hr or 230CFM. It is recommended for medium size rooms and it packs a ton of features.

Read More »

Review: Airthinx IAQ for Businesses

In a previous post, I presented Airthinx IAQ for Homeowners and how an advanced AQ monitor can be used for indoor environmental monitoring. In this post, we will explore how we can use the same monitor but in business environments (offices, industrial buildings, food supply chains, etc).

We will focus on the tools present in the dashboard as it is one of the best dashboards you will find in the market, and we will learn how to get the most out of it.

Let’s begin with the Dashboard – Home. Here we can create various types of widgets and arrange them according to our preference. First, you can see that I have created a column with all the current measurements with small graphs of the environmental parameters. Right next to it, I always watch for the general AQ, PM2.5, and Humidity. Below I have more widgets with other graphs and values that I want to have a glance.

Dashboard – Home

Next, we can see the Map tab. Here we can locate all the available monitors in a high precision as the monitors come with a GPS module, however, we will see later that we can manually set the location of the device.

Read More »

Top Free Air Quality Index (AQI) Apps

Globally, climate change has driven many catastrophic events like the huge wildfires in Australia and on the USA west coast. More and more people reached my blog to collect information about which Air Quality Monitor should invest in and which app should they download to get information about the air quality in their area.

Here are the TOP 6 Air Quality Index Apps that have helped me and others see the air, and they are free.

#1 Breathe

iOS by Tobias Tiemerding | 24MB | Free
v3.0 (beta)

Breathe is a great app for European citizens as it will pull data from the Sensor Community (formerly known as Luftdaten) server and will inform you in an instant about the Air Quality near you. You don’t have to own a monitor as long as there is one available in a radius of 10Km, and in case there are many monitors then it will pull data from the nearest from you. Thanks to the new update, it supports iOS 14 Widgets so you don’t even need to launch the app anymore, just place a tile into your home screen and you are ready.

#2 Local Haze

iOS by HumanLogic | 20MB | Free
v1.5.0

Local Haze is another great app similar to the Breathe, but it combines information from many sources including the Sensor Community with over 12,000 sensors, PupleAir, and uRad Smoggies. Also, it is available globally. You can choose your favorite monitor, and it also provides the confidence rating, that way we know which measurement to trust more.

#3 BreezoMeter

iOS & Android by BreezoMeter | 71MB | In-App Purchases
v3.5.1

BreezoMeter is the app with the most experience in the field of air quality, as the company behind it is leading the industry. Apart from air pollution data, it offers a pollen forecast for those who suffer from seasonal allergies. It uses its propitiatory AQI algorithm called BAQI to give a better insight of the air pollution in your area. Finally, it offers an air quality forecast for up to 6 hours.

#4 Plume Labs

iOS & Android by Plume Labs | 283MB | Free
v3.2.2

Plume Labs is another app with great experience in the field of air quality. It also uses a propitiatory AQI algorithm called PAQI but the company allows users to switch between one of the major AQI algorithms like US EPA AQI, Europe CAQI, China AQI, and Abu Dhabi ADAQI. Another feature that distinguishes Plume Labs is the air quality forecast for up to 4 days. Finally, it supports dark mode.

#5 Airly

iOS & Android by Airly | 25MB | Free
v1.13.2

Although Airly app was designed to support the Airly air quality monitors, it also supports PupleAir monitors and EPA stations and it is powered by Dark Sky service which was recently bought by Apple Inc. It supports dark mode and it is compatible with the US EPA AQI and the European AQI CAQI. Very fast responding app and visually pleasing.

#6 Live Air

iOS & Android by Origins Technology Limited | 50MB | Free
v3.1

Live Air (formerly known as Kaiterra Global Air Quality) is designed as a host app for the air quality monitors of the company (Kaiterra Laser Egg series). However, the company also focuses on ambient air quality data, and with the latest update, they have managed to combine both sources of air quality information (indoor and outdoor) elegantly.

Review: Airly PM + Gas

There is an enormous demand for air quality monitors in cities near forests that are susceptible to wildfires. Climate change has driven huge increases in wildfire area burned over the past few decades, and air quality data can help us protect public health more than ever.

Watch out! Wildfires are not the only source of air pollution in cities. Urban lifestyle with huge diesel/petrol SUVs and delivery trucks moving all around the city all day long emit huge amounts of toxic pollutants (NO2, CO, UFP, etc…) and during winter season wood stoves emit extra 12 times more PM2.5 pollution into the air we all breathe as a result they create an unhealthy environment for all.

Airly is an aspiring company that tries to empower individuals and communities with knowledge about the air they breathe by offering three different monitors that will meet the needs of a different situation. The Airly PM with is the basic version and measures particulate matter PM10, PM2.5, and PM1.0, the Airly PM + Gas (NO2 + O3), and finally, the Airly PM + Gas (SO2 + CO).

For this review, I will present to you the Airly PM + Gas (NO2 + O3) as I believe it represents better the urban environments free from industrial sites. In my city, the number one pollutant is ground level ozone as there is a huge production and transportation of vegetables and fruit all around Spain and Europe and plenty of sunlight.

Keep in mind, ground ozone forms from the interaction of nitrogen dioxide and some other pollutants with UV radiation from the sunlight.

Read More »

Outdoor Air Quality Monitors 2020Q4

Since my last update of the outdoor (ambient) air quality monitors list back in 2018, new products have been released into the market for various purposes and different budgets. Air quality monitors for professional use in cities and industrial sites and homeowners who want to supervise the ambient air quality outside their houses/apartments.

Read More »

Fitness Air Quality Monitor, is that possible?

Over the years, I have spoken with many companies in the field of air quality and once in a while, companies will tell me that they want athletes to purchase their devices in order to improve performance. I am always skeptical about this because I haven’t seen any integration of fitness data with the AQ monitors so far that could give some possible adverts or ways for the athlete to improve their performance. You don’t expect people to make assumptions you have to give them results and guide them in the right direction.

During covid-19 lockdown, I worked out at home and as I have access to a lot of data (fitness and air quality) I decided to make some experiments and see how my body reacts to poor indoor air quality and good indoor air quality and if the whole hypothesis works.

Smartwatches are very common these day and all of them feature a heart rate monitor and many more sensors. Recently, Apple and Fitbit released pulse oximeter sensors in their latest wearables. These new sensors in the smartwatches could unlock many more potentials and provide us with data that could save lives.

Let’s continue with the argument of what current AQMs could do if they combine fitness data. First of all, there is a possible problem. In case the monitor is stationary then it won’t be able to tell if the user was near the device or not during the workout session but this could be addressed as most times fitness data come along with GPS coordinates. By allowing the device to access the location data only when the user is in the same location as the AQM (home, gym, etc.) we solve the issue. Another possible solution is if the monitor comes with a Bluetooth/Ultra Wideband chip then it can easily sense the presence of the athlete/individual.Read More »

Review: SPARROW W500

We have discussed a lot of times how air pollution can affect human health in the long-term. However, there is one pollutant that can have a severe impact on our health even in small concentrations in the short-term: Carbon Monoxide (CO).

Carbon Monoxide is a colourless, odourless toxic gas. Carbon monoxide poisoning is the most common type of fatal air poisoning in many countries around the world because it is hard to detect with our senses and it is classified as highly toxic.

About half of the carbon monoxide in Earth’s atmosphere is anthropogenic from the burning of fossil fuels (diesel and gasoline), oil, paraffin, propane, natural gas, trash, and biomass.

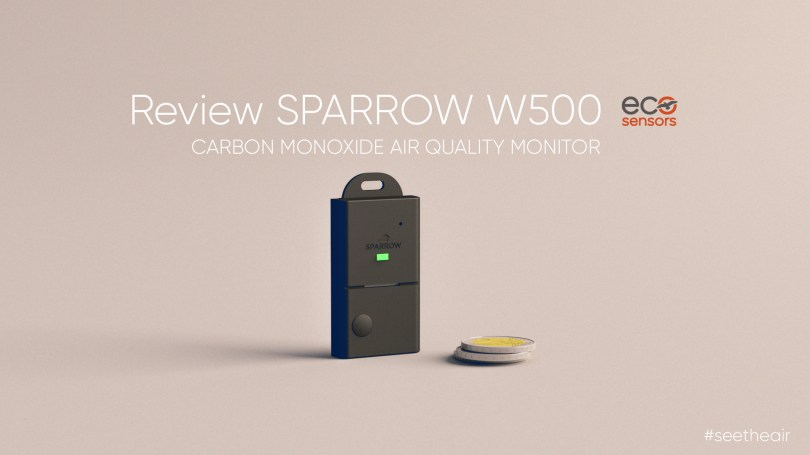
Here comes SPARROW W500 Air Quality Monitor by ECO SENSORS, a small portable monitor that can follow you anywhere. It is designed to alert you when high CO concentrations are present.

Hardware

  • Carbon Monoxide Sensor by SPEC Sensors
  • Humidity Sensor
  • Temperature Sensor
  • Alarm (audible buzzer)
  • Multicolour LED Light
  • Bluetooth Connection
  • Micro-USB port

SPARROW is super small  5.6cm x 3.3cm x 1cm and super light as it weighs 18g/0.03 lbs. You can pair it with a smartphone (iOS and Android) but also it can operate on its own as the buzzer and the Yellow/Red/Purple LED light can notify you when there are significant CO concentrations around. When the CO concentrations are safe the Green LED light will always flash once per second, except when charging, after all it can inform you about the CO concentrations without the need to launch the app or take your phone into your hands.

The battery will last 2 plus weeks, which is great for those who don’t want to charge one more device every day or so. I have set it with a 1 minute data log rate. The device has a button that you need to press every-time you want to connect it with the phone, that way the Bluetooth connection is established at the moment, otherwise the SPARROW would have to be in a mode where it was always broadcasting for Bluetooth signal, which is a huge power drain for both devices, phone and the air quality monitor.

Fortunately, my house is CO free as I don’t burn anything but we all travel and for those with a garage it is a mandatory device to have. In the picture below you can see the device inside a closed jar with smoke from a burning match as I wanted to stimulate the sensor and simulate the CO concentrations. I must say the CO sensor is a lot more stable and cross-sensitivity proof which means other gases won’t affect the measurements.

SPARROW_Jar CO

SPARROW comes with a carabiner clip but there is an option to attach it on the back of a phone case with a special mount system the case maker OtterBox has developed and they support many cases for iOS, Android phone, and tablets.
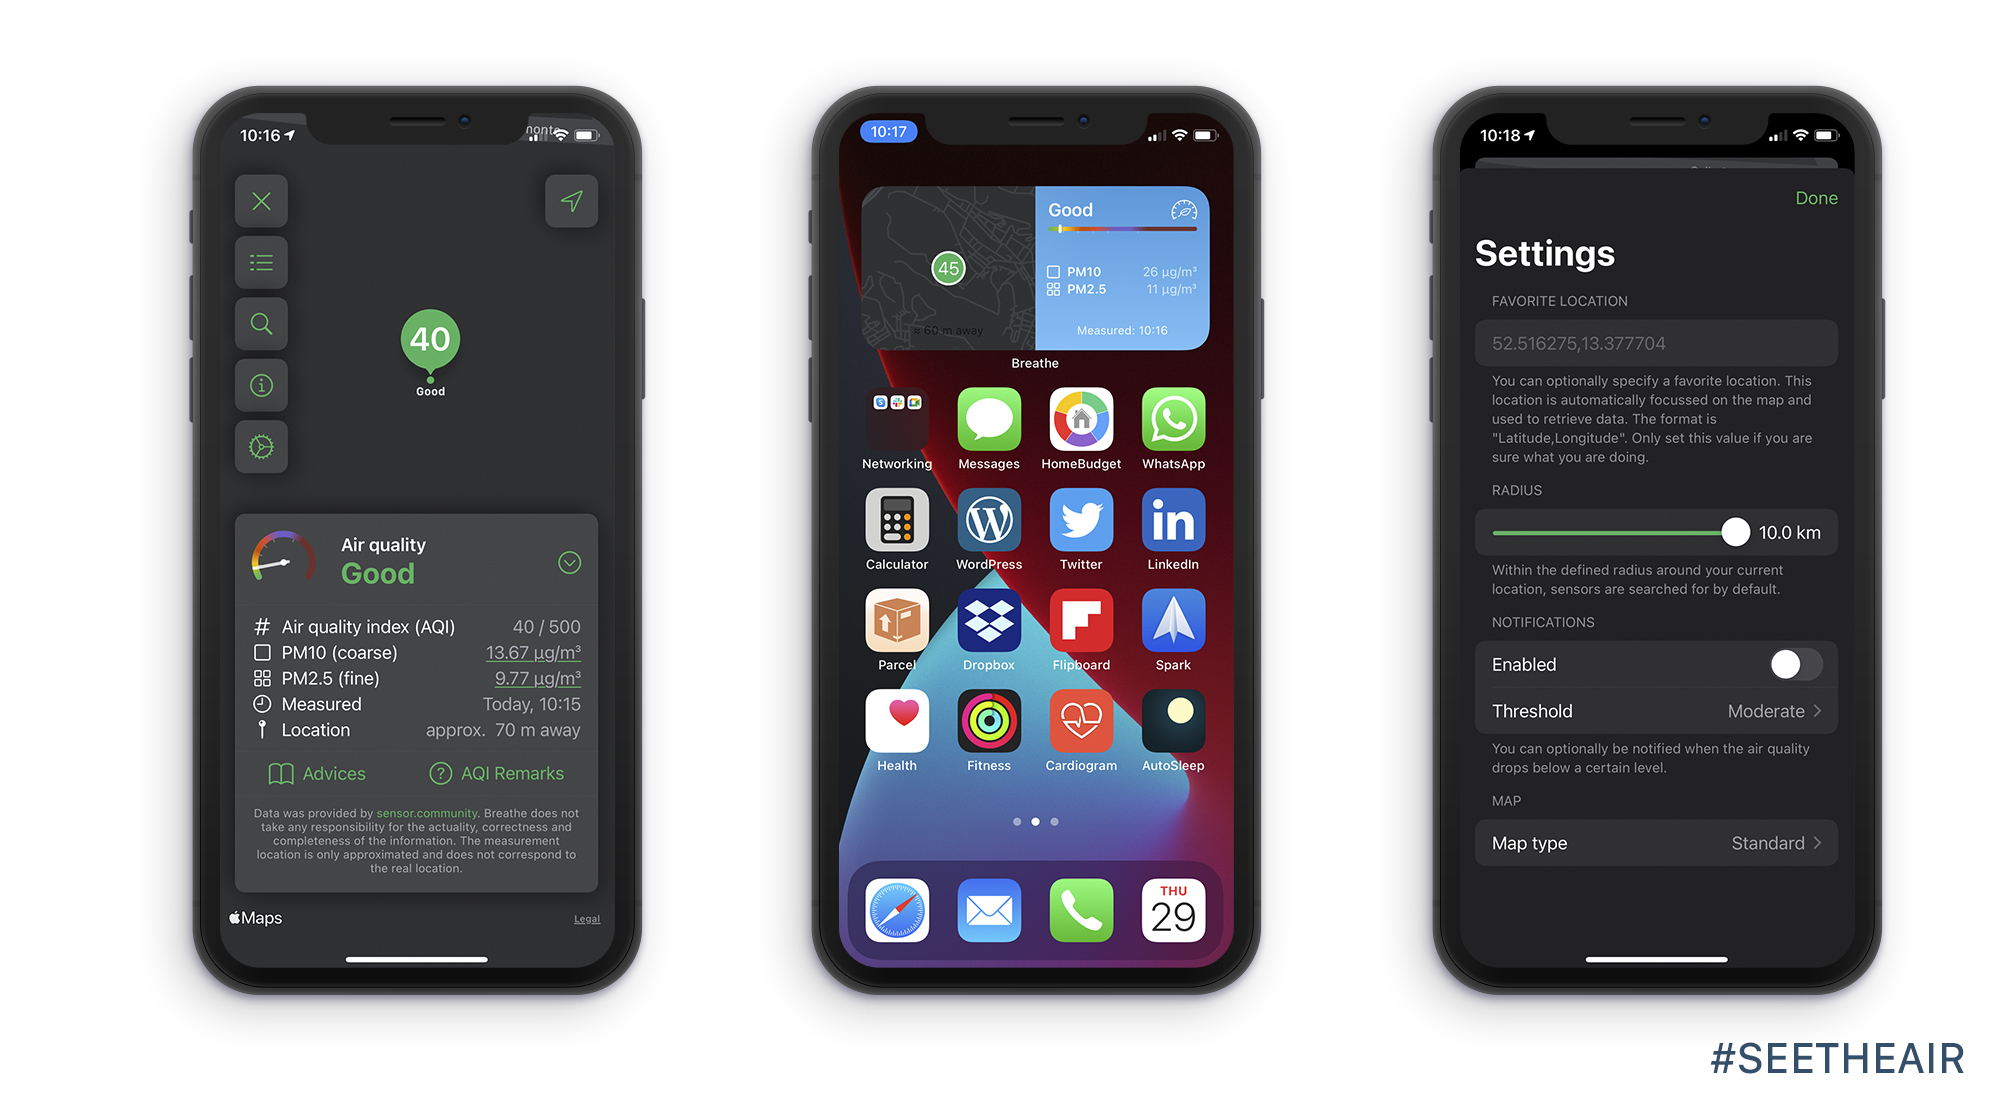
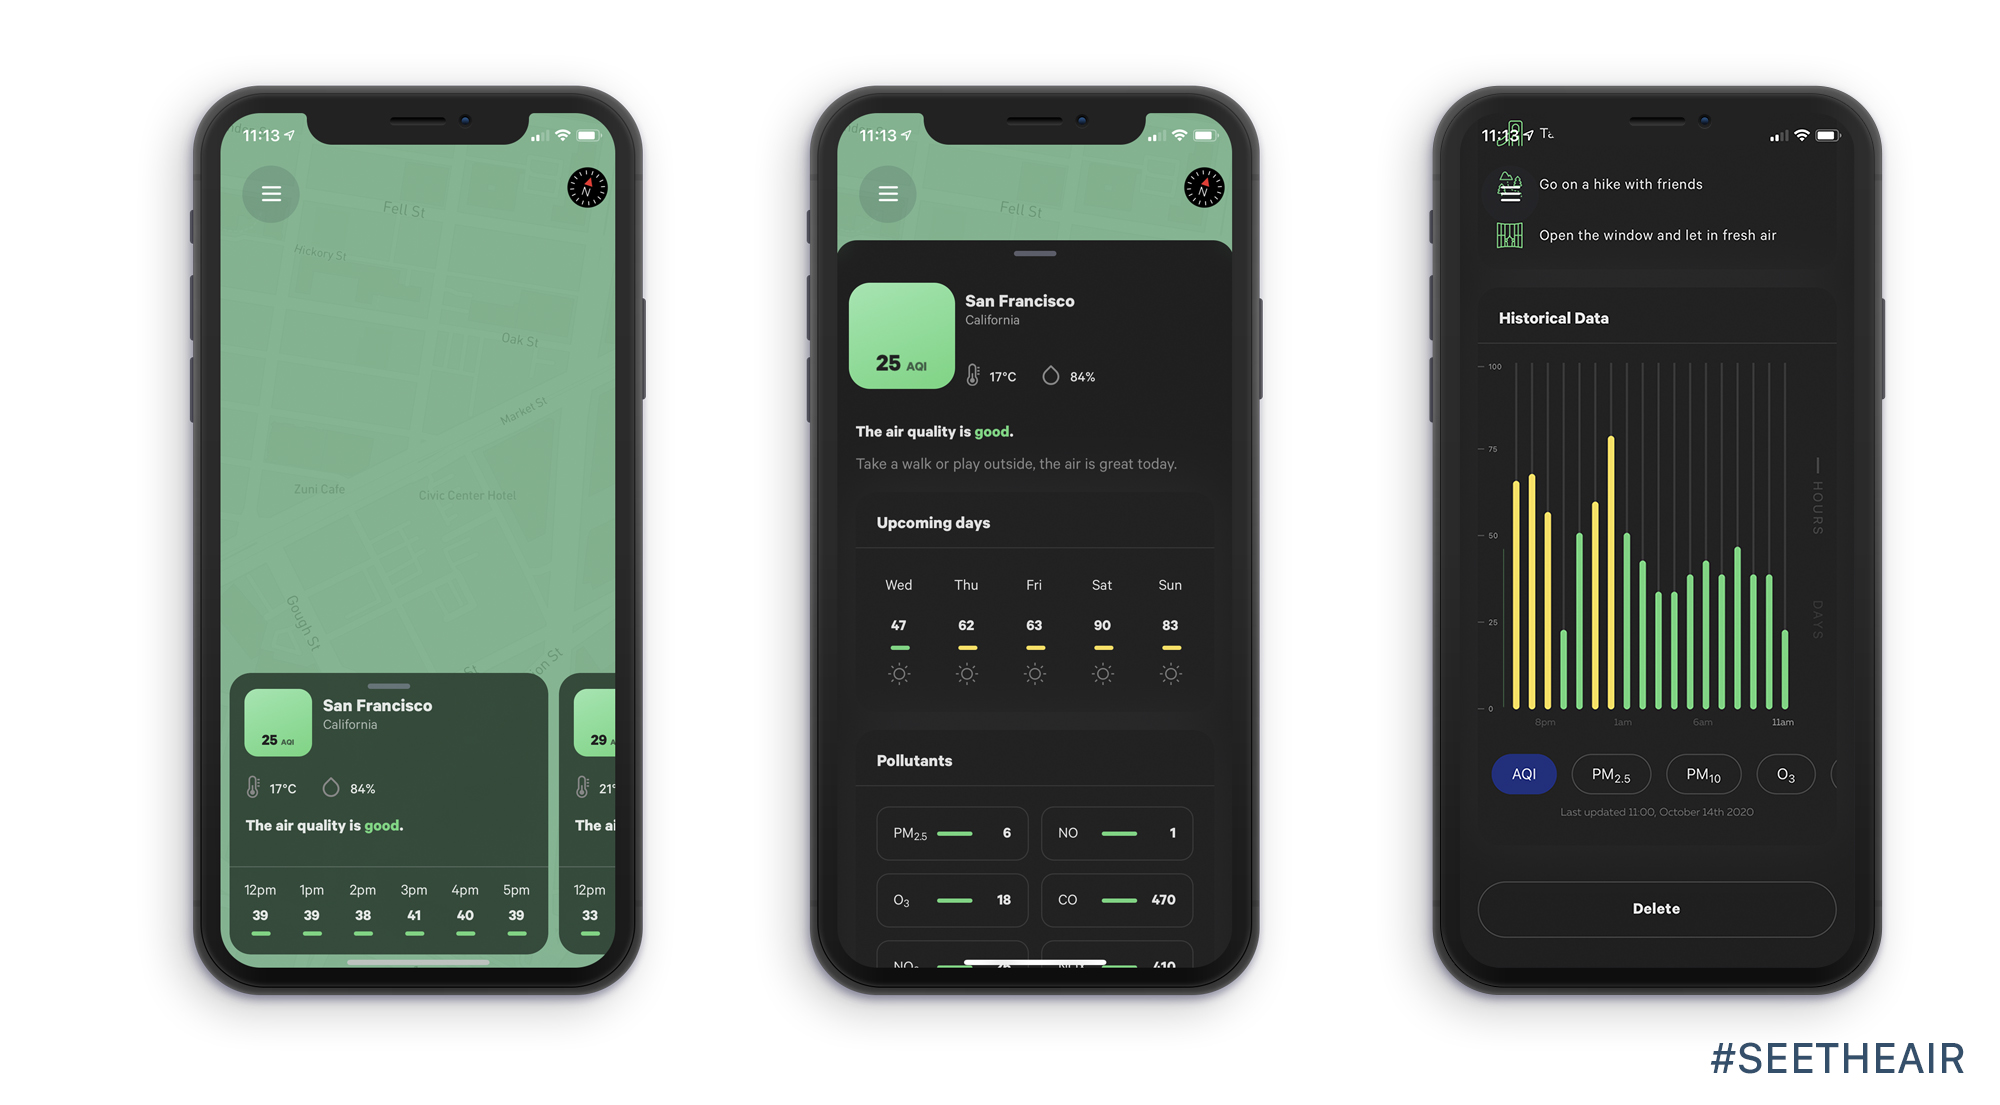
SPARROW Animation Case

The App

Visually, the app is not pretty but it does the job. There are a lot of options to tweak and to adjust the app and device to your needs but it lacks a better user experience UX though a better user interface UI. Of course, this is something that can be fixed with future app updates.

You can share the measurements (data Log file) via email which is a neat feature but they go a step further and you can connect the device with the micro-USB cable to your computer and enable direct communication, however, this is an advanced feature.

The app allows you to select different data log rates between 1 second / 10 seconds / 1 minute / 10 minutes / 1 hour / 1 day. There is another cool option to enable if you want  the device not to keep low CO concentrations in the log file, that way you don’t have a huge  amount of data entries to process later on, like in my case.

Literally, you can customise the device to your needs even by changing the Sensitivity mode for different thresholds. You can measure in parts per million (ppm) or milligrams per cubic meter (mg/m³). You can set up emergency messaging by allowing SPARROW app to send messages to emergency contacts when very high concentrations are detected.

Premium mobile phone screen mockup template


Conclusion

Breathing CO can cause a series of health issues. Unknowingly, exposure to moderate levels of CO over long periods of time has also been linked with an increased risk of heart disease. If your environment is surrounded by vehicles (suitable for #VanLife) or other sources of burning fossil fuels then having such a device that can guard your health is worth investing in. SPARROW W500 is one of them.

When is the best time to Exercise Outdoors in Athens, Greece?

Well, in winter and early spring never, period! If you are thinking of running or even walking in the center of Athens in Aristotelous street and around then prepare yourself to breathe a lot of pollution.

There is an official air quality station there and I pulled all available data for local statistical analysis from the European server (GR0003A). Unfortunately, 2019 nor 2020 measurements are available to the public yet, maybe in a decade, they will share the data for the Greeks to read. (Τι κάνεις έλληνα και δεν παραπονιέσαι για τον αέρα που αναπνέεις;).

Air Quality Station on top of the building Aristotelous street, Athens
Read More »