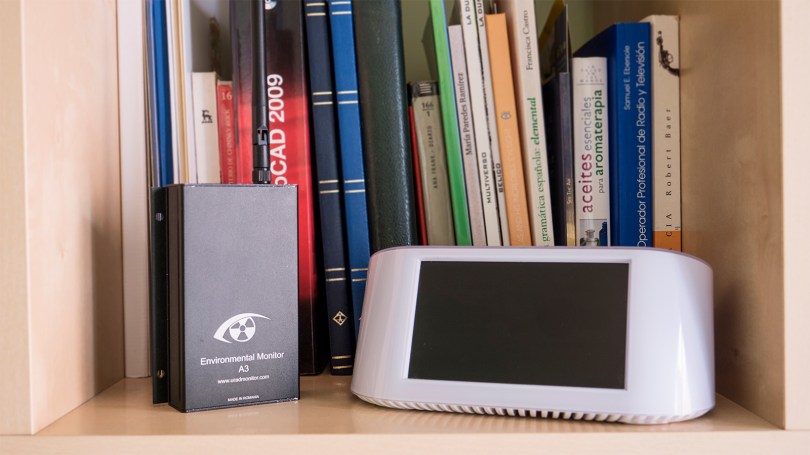
A USA air quality monitor in comparison with a DIY German air quality monitor. How well do they perform with each other? Full disclosure, the software the monitors run is developed in the mentioned countries. The components from both devices are made mostly in China.
- We already know PA-II’s correlation of coenficency R²≈0.87 with the corresponding FEM GRIMM and FEM BAM.
- The SDS011 sensor which is most commonly used in the Luftdaten project has a correlation of coenficency R² ≈0.84.
The PA-II features a double PMS5003 laser sensor. The PA-II module averages out the values from the two sensors, so in case one of the two sensors registers unexpected high readings, (perhaps some dust or insects etc) this technique makes the readings less questionable. The Luftdaten DIY project as we have mention above mostly uses one SDS011 laser sensor. However, the Luftdaten software supports many PM2.5 sensors including the PMS5003 series among others.
Analysis
My friend Ashley from Plume Plotter has already done a comparison between the Purple Air PA-II, the Luftdaten SDS011 and DEFRA for a complete year of data link.
First of all, by comparing PA-II’s two identical sensors we can see on the graph below that the Sensor B has the tendency to register higher concentrations over time, on my device, maybe another device has a different behavior. So the process of averaging out the concentrations from both sensors has some positive results.
Many scientific papers insist that the PMS5003 and SDS011 sensors are nephelometers and not particle counters. Which means that they are influenced by humidity. Nephelometer comes from the compound Greek word nephelo “Νέφος” which means cloud.
I live in an area with high humidity. Right now the official RH is 83%. The PA-II registers 51.6μg/m3 and Luftdaten 38.3μg/m3. The difference between them is huge. However, both devices are mistaken. Purely for your information the humidity sensor in the Luftdaten device measured RH 94% the PA-II measured RH 53% and AirVisual measured RH 72%. From my experience, I would say that the relative humidity is definitely above 80%.
From the graph below we can see the same results. The PM-II overestimates the PM2.5 concentrations most of the time in comparison with the Lufdaten sensor. Both devices seem to measure the same fluctuations over time so there is some correlation. The humidity that day started low at RH 30% and climbed up to 60% at the end of the day. There is an influence between humidity and how the sensors and especially the PA-II measure PM2.5 concentrations without any doubt.

Conclusion
The conclusion that I get from my everyday readings having the two devices side by side and from Plume Plotter’s analysis is that the PA-II overestimates the PM2.5 concentrations especially when relative humidity is above ~55% while the Luftdaten’s readings are more adjacent to the official readings.