I have featured both devices on my blog uRAD A3 & AirVisual and since both devices allow the user to download a .csv/.txt file with all the registered measurements and as they both have a laser PM2.5 sensor and a CO2 sensor, I decided to compare both of them farewell.
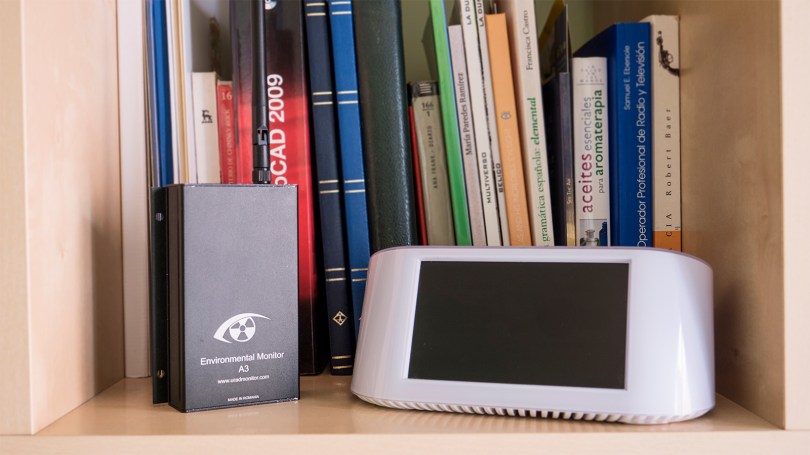
Although I connected both devices side by side on 28/02/2018 at 10:40 am, I will compare the measurements from 5th March 2018 to 7th March 2018 because I wanted to allow the devices to adjust on the new environment, which was my bookcase.
Each device takes measurements at a different time rate. AirVisual, for example, was set to take measurements every 10-15min and uRAD every minute. Unfortunately, I couldn’t set both devices at the same time rate.
The PM2.5 Comparison
I notice that each device uses a different algorithm to analyze the data. The data that the devices store are not raw. uRAD, for example, seems to subtract 3μg/m3 across all readings, as a result uRAD’s graph has more zero values. Of course you can say the opposite as well, that AirVisual adds 3μg/m3 across all readings. The peak value for AirVisual was 25μg/m3, but for uRad was 22μg/m3. Overall they have similar readout but they treat raw data differently.

The Carbon Dioxide CO2 Comparison
They had a great correlation. You may see a time difference when I compare both graphs one on top of the other, but this is due to the time rate difference each device registers a value.

Conclusion
I was very happy to see that both devices are great for reading Particulate Matter PM2.5 and Carbon Dioxide CO2. It is absolutely enlightening to know that the device you trust for measuring air quality in your house or work measures pollutants accurately.
Discover more from See The Air
Subscribe to get the latest posts sent to your email.
