Comparison: CO2 Monitors – Why do we need them in indoor environments?

I should have written this comparison a long time ago, but I was very busy the past few months. A lot of you have insisted, so here it is.

A CO2 monitor is the number one tool that can help us understand ventilation rates in indoor environments and consequently mitigate the spread of airborne viruses like coronavirus (SARS-CoV-2), but let’s not forget the common flu either.

Carbon Dioxide CO2 can decrease our cognitive ability. The correlation between CO2 and productivity has been studied a lot for over 50 years by many academics. Interesting facts, the design standard for CO2 levels in most buildings is 1000ppm but the recommended concentration is below 700ppm. In one of the studies, Harvard researchers have found significant negative impact at 930 ppm.

According to World Green Building Council, they estimate the reduced absenteeism through sick days to be worth ~$35/m2. Again the World Green Building Council estimates that if employees’ productivity improves by even a 5% because of better IAQ, that alone would be worth ~$400/m2.

The monitors are divided into two categories, the ones that can be carried with you (portable/wearable) and the fixed ones and in most cases professional solutions. Each monitor offers different characteristics. Sometimes just because it has more features, it doesn’t mean that it is the right tool for you.

Most of the monitors offer much more than just CO2 monitoring. We spend a lot of time indoors and a more holistic approach is needed sometimes when it comes to indoor air quality (IAQ) or indoor environmental quality (IEQ).
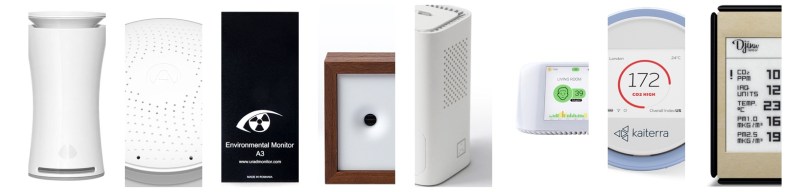
The monitors are:

Analox CO2BUDDY

The CO2BUDDY is the only wearable CO2 monitor that can be used in so many places and for a variety of reasons. Very important for professionals that work in places where the conditions are extreme. Closed or crowded indoor spaces.

Aranet4 HOME

Aranet4 is a small and portable CO2 monitor that surprises people. It can be used as an indicator of productivity in schools and office buildings. It is packed with smart features for those that want to log measurements and share them later on.

Awair OMNI

Awair OMNI is a well-thought product that has one aim, to help professionals see the air and address potential issues. The Awair Display Mode allows users to display any information from the monitor to a big screen inside a bar, restaurant, office, school, etc. It features up to 8 hour battery and logs data on-device. It complies with the most common certifications from WELL V1, LEED, Fitwel, LBC, and RESET.

Ethera Labs TX mini

The Ethera Labs XT Mini ensures quality and competitive monitoring systems with great cloud platforms for all needs and budgets. By connecting the monitor to BMS, they manage to achieve energy efficiency while directly managing the ventilation system, as well as portable air purifiers. It is the only monitor that can be connected to a PC via USB and upload data locally.

Kaiterra Sensedge mini

The Sensedge Mini is a great and accessible choice for those that wish to get or not air quality certification by RESET, LEED, WELL, and others as the monitor complies with their requirements. The removable sensor modules reduce maintenance costs and ensure accuracy, something really important when you want to offer comfort and health to the building’s occupants.

Airthings Wave Plus

Airthings Wave Plus is designed for professionals and homeowners (different plans). It offers a great dashboard that makes air quality data comprehensive. Excellent low power CO2 sensor that runs on two AA batteries for up to 16 months and the colour LED ring can indicate the high CO2 levels. Additionally, it can measure Radon which is a radioactive gas.

Analox Air Quality Guardian

The Air Quality Guardian comes with a large LCD display that provides plenty of clear information for those professionals that don’t have the luxury of time to continually take their phones out of their pockets in order to check the CO2 concentrations and trends. Very loud alarm and great traffic light system🚦 where 3 LED lights will turn on depending on the concentration of CO2 in the indoor environment.

airthinx IAQ

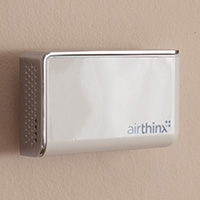
Airthinx IAQ is designed for professionals, however, it is also available to homeowners too. The dashboard offers so many features that can really help you build a solid business model around it as you can rent the device(s) to third parties. The company provides a solid ecosystem of hardware and software, hard to resist.

Quick Comparison

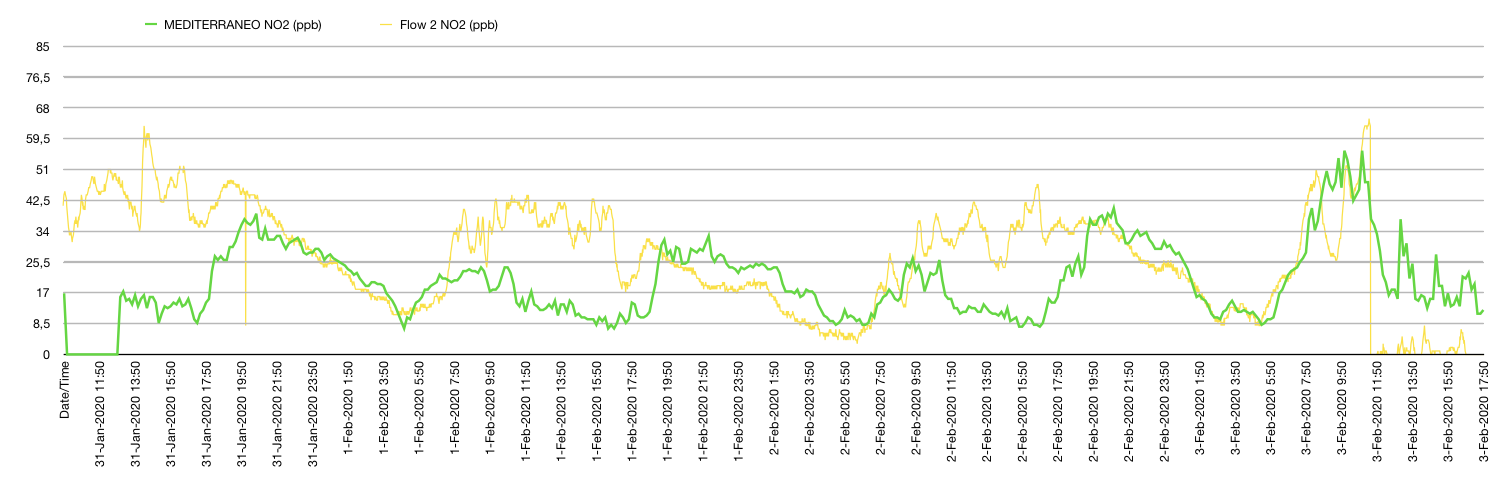
All monitors deliver great CO2 measurements as I have tested them all. They all feature a non-dispersive infrared (NDIR) sensor which is the best among the low-cost sensors because of their accuracy and low-power consumption.

Each monitor has unique features, so read each review individually to discover if it is the right fit for you.

Shopping Guide: Air Quality Monitors

As you already know, I receive messages from readers of my blog almost every day. Their most common question is which air quality monitor should they choose. Most of the time in their message, they tell me that they go through Amazon to find a product, but they are confused from their reviews.

Carbon Dioxide (CO2) Monitors are a big hit nowadays due to the pandemic and because they are great tools at helping us understand indoor ventilation in order to mitigate the spread of the virus. Many new CO2 monitors pop up every day like mushrooms. Are they good, well …. you have to be careful!

No offense to Amazon or AliExpress or Facebook but most of their products are garbage for two reasons. Firstly, they are cheap products that come from China but without any quality control. Apple products come from China too, but Apple controls the quality of the shipping products. I have reviewed some cheap air quality monitors here on the blog just to justify their low price tag. Secondly, companies that sell these products don’t offer any kind of support nor updates. If the product has a small bug, you will stick with it forever. Many times the language they come with is badly translated or they come in Chinese if you are not careful enough during the purchase process.

Read More »

In-Depth Review: Wynd Halo 1st Edition Sensors

The Wynd Halo 1st Edition uses a proprietary PM sensor with a blue-light laser instead of a red-light laser, which presumably makes it more accurate and precise. Interestingly, I remember during the Kickstarter campaign of the monitor, backers were asking the company if they will sell the sensor as a component part to third parties, and they said yes because it was about to revolutionize the industry.

Although I don’t have a reference monitor, the comparison I conducted is considered a field evaluation in a real-life situation. AQ Monitors are designed to operate inside apartments and buildings for this reason I personally value more a field evaluation in situ than a lab evaluation where every parameter is controlled.

This kind of evaluation won’t tell us how accurate is the sensor, but it will reveal the correlation against other monitors in order to determine if measure something respectable. For example, there are many field and lab evaluations for the commonly found Plantower PMS5003 sensor that demonstrate a correlation of 0.78 – 0.93 against various reference monitors.

Read More »

Air Quality Monitors – Comparison List 2020 Q4

It has been a while since the last time I updated the list with all the air quality monitors in the market. Just to be clear, there are a lot more Chinese knockouts that I haven’t included because they don’t have any support from the companies either they offer something unique.

This time the list includes some Pro-level indoor AQMs like the elichens
Indoor Air Quality PRO Station
and the NEMo XT – Indoor.

  • Prices may vary during time.
  • Some Companies don’t specify on their data sheet if their devices are capable to measure PM2.5 or PM10 and they just mention the word dust.
  • Some other companies say: Our product goes beyond CO₂ by analyzing substances that directly affect your well-being by measuring VOCs. They aren’t clear if their devices have CO₂ sensor.
  • Some of the devices are AQI Monitors and Air Purifiers Combo. On this list you can only read the features as an AQI monitor.

Low-Cost Portable Monitors vs Reference Monitors Part1

I managed to grant permission from the local authorities (Junta de Andalucia) here in my city Almeria to place two low-cost monitors among the reference instruments in order to determine whether the two consumer products could offer fair readings to the users.

After filing some paperwork and the help of the responsible people in my city, they granted me access to the reference Monitor ES1393A (Mediterráneo) that complies with all EU standards. It is a quite powerful station as it is equipped with many expensive instruments (figure 1) which measure many types of pollutants, such as Nitrogen Oxide (NO), Nitrogen Dioxide (NO2), ground-level Ozone (O3), Carbon Monoxide (CO), Sulphur Dioxide (SO2), PM10, PM2.5 and many more.

The portable consumer-grade monitors that I placed in the reference AQ station were the Atmotube Pro and the Flow 2. Of course, I placed them outside the station and I attached them to the PM2.5 beta attenuation monitor air inlet (as you can see in figure 2) because I wanted to ensure the greatest PM2.5 correlation possible.

A beta attenuation monitor (BAM) is a universally used air monitoring technique that employs the absorption of beta radiation by solid particles extracted from airflow. This technique allows for the precise detection of PM2.5 without humidity affecting the results (a common problem for the laser scattering sensors). However, there are some drawbacks, for instance, it doesn’t provide data in real-time and it takes only a few measurements in an hour.


The portable monitors took measurements continuously for three and a half days with an interval of 1 minute between each measurement. The reference monitors took measurements every 10 minutes, so the data from the reference monitor are not as dense as from the Atmotube and Flow but are much more accurate and even without the same density we will be able to get a good idea of what is going on.

Before presenting the results from this comparison, I would like to mention that my measurements cannot be taken as a “de facto”. In order to determine the real correlation of a monitor or a sensor, you need at least 3 units and various days to months of data. Maybe some other units from both parties, PlumeLabs and Atmotube, may give different results. The climate also affects the performance of the sensors, so a different geographical location can give us different results.

Nitrogen Dioxide

Let’s begin with the comparison of the NO2 gas sensor inside the Flow 2 and the reference monitor Teledyne Model 200E. The official measurements were in μg/m3 so I had to convert them into parts per billion (ppb). Converting the original values to ppb is not an easy task as you have to know the molecular weight of the pollutants (NO2=46.0055g/mol) and most importantly the temperature and atmospheric pressure at the time each value was taken, the problem was that they didn’t provide me with that data and I didn’t have them either. As a result, I looked them up and the average values were 15°C/59°F and 1019hPa, so to simplify my workflow I used those numbers in the formula for all the conversions. I know, I know, the data from the reference monitor are not 100% correct now but they are very close so they will do the trick.

NO2 Flow Reference Monitor correlation
Green: Teledyne Model 200E | Yellow: Flow 2

As you can see in the graph above there are quite many similarities in the trajectory of the lines. I was quite surprised and happy to be honest. You can clearly see how the low-cost sensor keeps getting exited from the pollutant(s) for a longer time but it was able to follow the official measurements. Keep that in mind, the official monitor Teledyne Model 200E worths around 8,000€ and Flow worths 159€.

Particulate Matter

Let’s continue our comparison with the Particulate Matter sensors from Atmotube Pro and Flow 2. Firstly, let’s see the PM10 measurements as the reference monitor Met One Instrument BAM 1020 (~18,000€) only provided the PM10 concentrations. The air inlet for the PM10 was about a meter away from where the 2 portable AQ monitors were placed and this is one of the reasons we can see that the concentrations from the BAM 1020 were much higher than the low-cost sensors.

Reference monitor BAM 1020 and low cost sensors Flow Atmotube
Green: BAM 1020 | Blue: Atmotube Pro | Yellow: Flow 2

Atmotube was able to follow the same trajectory as the BAM 1020 and when I multiply by x3.0 the output concentrations of the Atmotube the trend was much more similar (see graph below). On the other hand, Flow 2 was not able to keep up with the reference monitor. Flow’s (Yellow) line does not follow the reference monitor and I was unable to find any correlation.

atmotube PRO reference monitor BAM 1020
Red: Atmotube Pro with amplified x3 PM10 output.

As the BAM PM2.5 measurements are being analysed in a lab right now in order to ensure accuracy by the state I will compare the result in a different post. They gave me an estimation of about a month.

Conclusion

It gives you a level of confidence to know that the little AQ monitor that you carry with you is able to reveal the truth about the air you breathe. Although the results are not perfect they can provide some general guidelines to the users.

Stay tuned for the final PM2.5 comparison, will Flow 2 have better PM2.5 measurements and will Atmotube Pro keep up?

Flow 2 vs Atmotube Pro Preliminary Comparison

I love portable devices and miniaturisation is a thing of the future. In this post, I am going to compare Flow 2 and Atmotube Pro side by side. Both devices are two portable Air Quality Monitors that can easily be carried around and help you see the air you breathe.

This is a preliminary test and I will compare the devices between each other. I have promised you an extensive comparison between the portable monitors and an official reference station, however, it will take a bit longer in order to sort things out with the local AQ department − paperwork which needs time from their end.

Read More »

2019: Year in Review

One day is left before the planet Earth, where 7.8 Billion people live, completes its orbit around the Sun. During our journey around the Sun and inside the universe we witnessed some good and bad moments for our planet and us.

We saw some terrible disasters like the Amazon rainforest wildfires, Bushfires in Australia, fires all over the world, which were very hard to control because of the extreme weather and climate change that rewards and favors such as extreme phenomenal to happen.

Read More »

In-Depth: Atmotube Pro

It will please some of you to know that I am going to compare Atmotube Pro with other Particulate Matter sensors and monitors. First with an outdoor monitor and in this case the Luftdaten DIY and second the AirVisual which is more of an indoor monitor.

Before I begin with the comparisons I want to dive a bit deeper and tell you that apart from exporting the .csv from the app directly, you can also access Atmotube’s .csv files (in case you have an iPhone) from the File Sharing service iTunes provides when you connect your phone with your computer (macOS & Win). This way you have more control over which days you upload to your computer.

Read More »

Indoor IAQ Monitors 2019Q2

Here are all the available IAQ Monitors on the market. This time and after your help I have included many more information in a Google Spreadsheet document which you are going to appreciate a lot, such as website links and whether the device has been reviewed on my blog or not yet. There are so many devices out there but they all lack innovation and they all offer exactly the same technologies. Companies had better hear users feedback!

Read More »