There is a demand for Green Buildings lately, which focus on the comfort and health of the building’s occupants. Energy efficiency was the original target for most of the green buildings certifications programs, but they have evolved, and they now focus on many more aspects of the indoor environments. Indoor Air Quality has become the number one priority for many green building certifications, and in order to be certified, there are strict rules for ventilation and AQ monitoring.
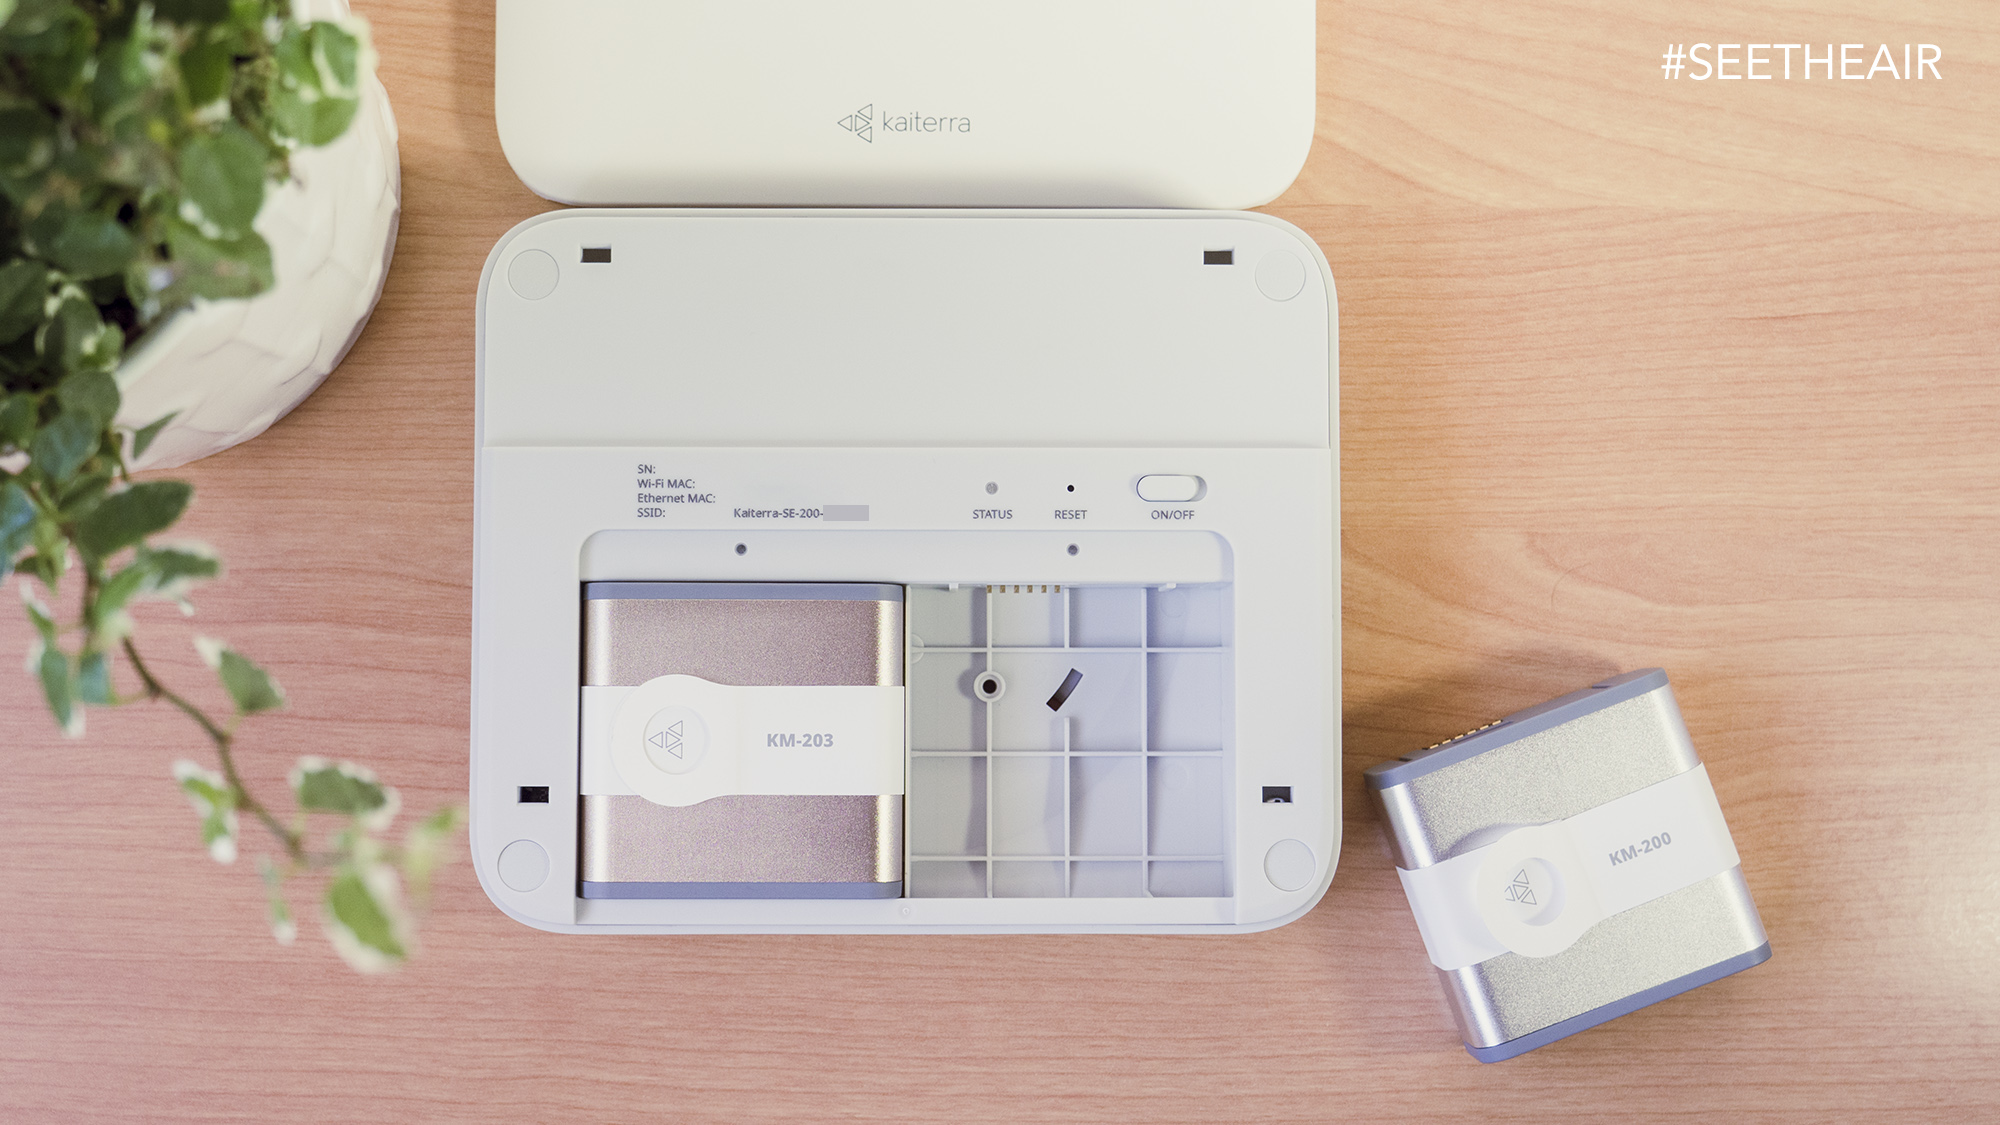
Here comes Kaiterra Sensedge Mini, which is a RESET certified indoor air quality monitor. The Sensedge Mini is a calibrated real-time monitor that has to be placed in buildings that wish to obtain a Green Buildings certification.
The Sensedge Mini uses two removable sensor modules to replace the traditional, costly calibration processes for long-term accuracy with minimal maintenance.
I have been talking about air quality monitors and air purifiers in this blog for a long time. They help us see the air we breathe and mitigate pollution. However, is there a way to measure the impact of pollution on our lungs?
Well yes, thanks to technological advances and spirometry, which measures lung function, doctors can use these data in assessing breathing patterns that identify conditions such as asthma, pulmonary fibrosis, cystic fibrosis, and COPD.
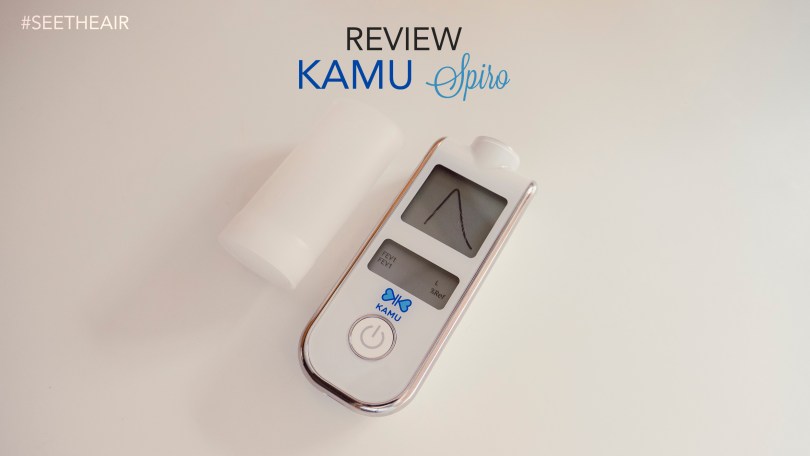
In this review, I am going to present to you the KAMU Spiro. It is a handheld bluetooth device that helps us test our lung function at home with a hospital-grade mobile spirometer.
With a single test, we can get FEV1, FEV1/FEV6, FVC, and PEF values. The spirometry results are saved in KAMU Spiro’s memory until we upload them to our KAMU Asthma app, where we can view them at any time.
Over the years, I have spoken with many companies in the field of air quality and once in a while, companies will tell me that they want athletes to purchase their devices in order to improve performance. I am always skeptical about this because I haven’t seen any integration of fitness data with the AQ monitors so far that could give some possible adverts or ways for the athlete to improve their performance. You don’t expect people to make assumptions you have to give them results and guide them in the right direction.
During covid-19 lockdown, I worked out at home and as I have access to a lot of data (fitness and air quality) I decided to make some experiments and see how my body reacts to poor indoor air quality and good indoor air quality and if the whole hypothesis works.
Smartwatches are very common these day and all of them feature a heart rate monitor and many more sensors. Recently, Apple and Fitbit released pulse oximeter sensors in their latest wearables. These new sensors in the smartwatches could unlock many more potentials and provide us with data that could save lives.
Let’s continue with the argument of what current AQMs could do if they combine fitness data. First of all, there is a possible problem. In case the monitor is stationary then it won’t be able to tell if the user was near the device or not during the workout session but this could be addressed as most times fitness data come along with GPS coordinates. By allowing the device to access the location data only when the user is in the same location as the AQM (home, gym, etc.) we solve the issue. Another possible solution is if the monitor comes with a Bluetooth/Ultra Wideband chip then it can easily sense the presence of the athlete/individual.Read More »
It has been a while since the last time I updated the list with all the air quality monitors in the market. Just to be clear, there are a lot more Chinese knockouts that I haven’t included because they don’t have any support from the companies either they offer something unique.
This time the list includes some Pro-level indoor AQMs like the elichens Indoor Air Quality PRO Station and the NEMo XT – Indoor.
Prices may vary during time.
Some Companies don’t specify on their data sheet if their devices are capable to measure PM2.5 or PM10 and they just mention the word dust.
Some other companies say: Our product goes beyond CO₂ by analyzing substances that directly affect your well-being by measuring VOCs. They aren’t clear if their devices have CO₂ sensor.
Some of the devices are AQI Monitors and Air Purifiers Combo. On this list you can only read the features as an AQI monitor.
We have discussed a lot of times how air pollution can affect human health in the long-term. However, there is one pollutant that can have a severe impact on our health even in small concentrations in the short-term: Carbon Monoxide (CO).
Carbon Monoxide is a colourless, odourless toxic gas. Carbon monoxide poisoning is the most common type of fatal air poisoning in many countries around the world because it is hard to detect with our senses and it is classified as highly toxic.
About half of the carbon monoxide in Earth’s atmosphere is anthropogenic from the burning of fossil fuels (diesel and gasoline), oil, paraffin, propane, natural gas, trash, and biomass.
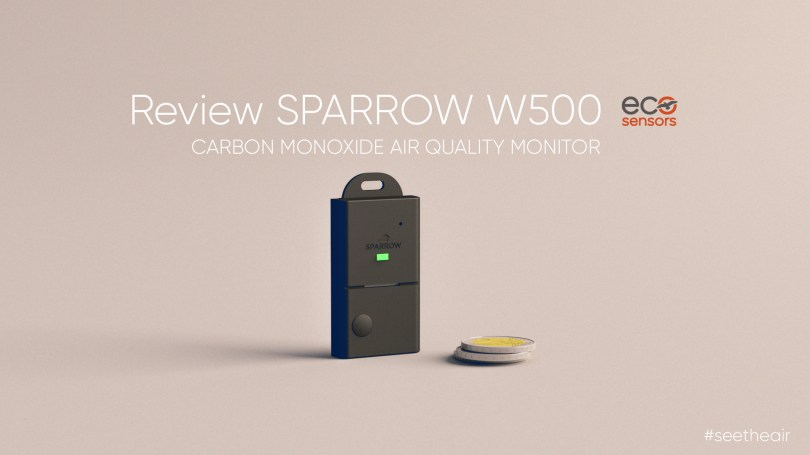
Here comes SPARROW W500 Air Quality Monitor by ECO SENSORS, a small portable monitor that can follow you anywhere. It is designed to alert you when high CO concentrations are present.
Hardware
Carbon Monoxide Sensor by SPEC Sensors
Humidity Sensor
Temperature Sensor
Alarm (audible buzzer)
Multicolour LED Light
Bluetooth Connection
Micro-USB port
SPARROW is super small 5.6cm x 3.3cm x 1cm and super light as it weighs 18g/0.03 lbs. You can pair it with a smartphone (iOS and Android) but also it can operate on its own as the buzzer and the Yellow/Red/Purple LED light can notify you when there are significant CO concentrations around. When the CO concentrations are safe the Green LED light will always flash once per second, except when charging, after all it can inform you about the CO concentrations without the need to launch the app or take your phone into your hands.
The battery will last 2 plus weeks, which is great for those who don’t want to charge one more device every day or so. I have set it with a 1 minute data log rate. The device has a button that you need to press every-time you want to connect it with the phone, that way the Bluetooth connection is established at the moment, otherwise the SPARROW would have to be in a mode where it was always broadcasting for Bluetooth signal, which is a huge power drain for both devices, phone and the air quality monitor.
Fortunately, my house is CO free as I don’t burn anything but we all travel and for those with a garage it is a mandatory device to have. In the picture below you can see the device inside a closed jar with smoke from a burning match as I wanted to stimulate the sensor and simulate the CO concentrations. I must say the CO sensor is a lot more stable and cross-sensitivity proof which means other gases won’t affect the measurements.
SPARROW comes with a carabiner clip but there is an option to attach it on the back of a phone case with a special mount system the case maker OtterBox has developed and they support many cases for iOS, Android phone, and tablets.
The App
Visually, the app is not pretty but it does the job. There are a lot of options to tweak and to adjust the app and device to your needs but it lacks a better user experience UX though a better user interface UI. Of course, this is something that can be fixed with future app updates.
You can share the measurements (data Log file) via email which is a neat feature but they go a step further and you can connect the device with the micro-USB cable to your computer and enable direct communication, however, this is an advanced feature.
The app allows you to select different data log rates between 1 second / 10 seconds / 1 minute / 10 minutes / 1 hour / 1 day. There is another cool option to enable if you want the device not to keep low CO concentrations in the log file, that way you don’t have a huge amount of data entries to process later on, like in my case.
Literally, you can customise the device to your needs even by changing the Sensitivity mode for different thresholds. You can measure in parts per million (ppm) or milligrams per cubic meter (mg/m³). You can set up emergency messaging by allowing SPARROW app to send messages to emergency contacts when very high concentrations are detected.
Conclusion
Breathing CO can cause a series of health issues. Unknowingly, exposure to moderate levels of CO over long periods of time has also been linked with an increased risk of heart disease. If your environment is surrounded by vehicles (suitable for #VanLife) or other sources of burning fossil fuels then having such a device that can guard your health is worth investing in. SPARROW W500 is one of them.
This review is dedicated to the end-users (homeowners) as I present the tools (Smartphone app) and functionalities of the device for the average user and some basic features on the dashboard. Later on, I will review the same monitor for businesses where we will have the chance to see and analyze the more advanced tools which are present on the dashboard for all.
Airthinx IAQ is an Air Quality Monitor (AQM) that was built for experts with many communication protocols in order to ensure that users will be able to access air quality measurements from anywhere and air quality sensors that matter in the indoor environment.
Technical Specifications
PM1 / PM2.5 / PM10 Sensors (0~500 μg/m3)
CO2 Sensor (0~3000 ppm)
CH2O Sensor (0~1 mg/m3)
TVOC Sensor (1-10ppm of EtOH) (0-1ppm of Isobutylene)
Have you ever wondered how to use the RGB LED bulb you have purchased in a more productive way? Sure, you can control the lights via your phone but this is not “smart” plus if you manage your lights with your phone it may take longer to turn off and on a light fixture than just by hitting the switch.
The obvious is to set up a visual (light) indicator each time the air quality is poor in your house, for example, when PM2.5 is high, then the lights flash twice with orange colour. However, the ultimate way to give real value to a smart light bulb is when the combination of an AQ monitor and a light bulb can save your life in a real-life threatening situation. How?
In September 2019, I reviewed a great air quality monitor called Djinn. One of the unique features of this device is the algorithms that are running in its core. The team of Djinn was able to move even further their technology by designing a respiratory virus risk among others analytics on their dashboard, which is very handy during the covid-19 pandemic.
The team took part in the “A Call for Action” towards building the data infrastructure and ecosystem we need to tackle pandemics and other dynamic societal and environmental threats.Read More »
In the past 6 months, Smoggies are operating and providing useful air quality insights to the users and the communities all around the world. Right now, there are more than 250 units in total, worldwide.
I decided to see how polluted the air was for my 8 volunteers during the month of February, 2020. Let’s set the record straight and remind ourselves that the WHO guideline stipulates that PM2.5 not exceed 10μg/m3 annual mean, or 25μg/m3 24-hour mean.
I managed to grant permission from the local authorities (Junta de Andalucia) here in my city Almeria to place two low-cost monitors among the reference instruments in order to determine whether the two consumer products could offer fair readings to the users.
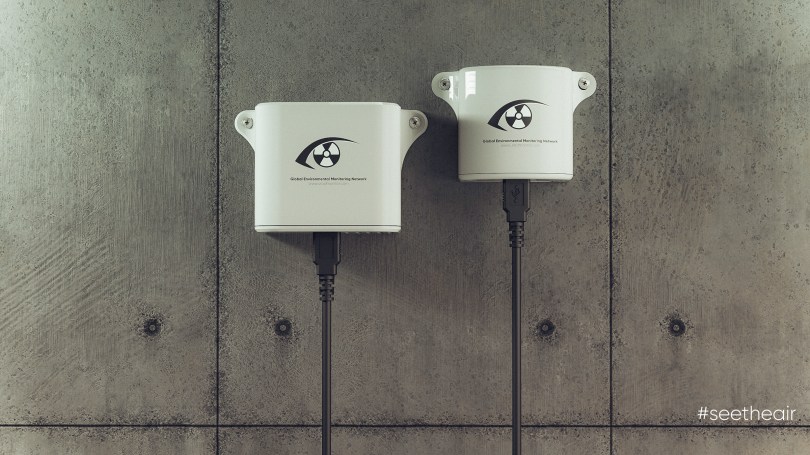
After filing some paperwork and the help of the responsible people in my city, they granted me access to the reference Monitor ES1393A (Mediterráneo) that complies with all EU standards. It is a quite powerful station as it is equipped with many expensive instruments (figure 1) which measure many types of pollutants, such as Nitrogen Oxide (NO), Nitrogen Dioxide (NO2), ground-level Ozone (O3), Carbon Monoxide (CO), Sulphur Dioxide (SO2), PM10, PM2.5 and many more.
The portable consumer-grade monitors that I placed in the reference AQ station were the Atmotube Pro and the Flow 2. Of course, I placed them outside the station and I attached them to the PM2.5 beta attenuation monitor air inlet (as you can see in figure 2) because I wanted to ensure the greatest PM2.5 correlation possible.
A beta attenuation monitor (BAM) is a universally used air monitoring technique that employs the absorption of beta radiation by solid particles extracted from airflow. This technique allows for the precise detection of PM2.5 without humidity affecting the results (a common problem for the laser scattering sensors). However, there are some drawbacks, for instance, it doesn’t provide data in real-time and it takes only a few measurements in an hour.
Figure 1: Air Pollution Monitors
Figure 2: BAM air inlet and Portable AQ Monitors
The portable monitors took measurements continuously for three and a half days with an interval of 1 minute between each measurement. The reference monitors took measurements every 10 minutes, so the data from the reference monitor are not as dense as from the Atmotube and Flow but are much more accurate and even without the same density we will be able to get a good idea of what is going on.
Before presenting the results from this comparison, I would like to mention that my measurements cannot be taken as a “de facto”. In order to determine the real correlation of a monitor or a sensor, you need at least 3 units and various days to months of data. Maybe some other units from both parties, PlumeLabs and Atmotube, may give different results. The climate also affects the performance of the sensors, so a different geographical location can give us different results.
Nitrogen Dioxide
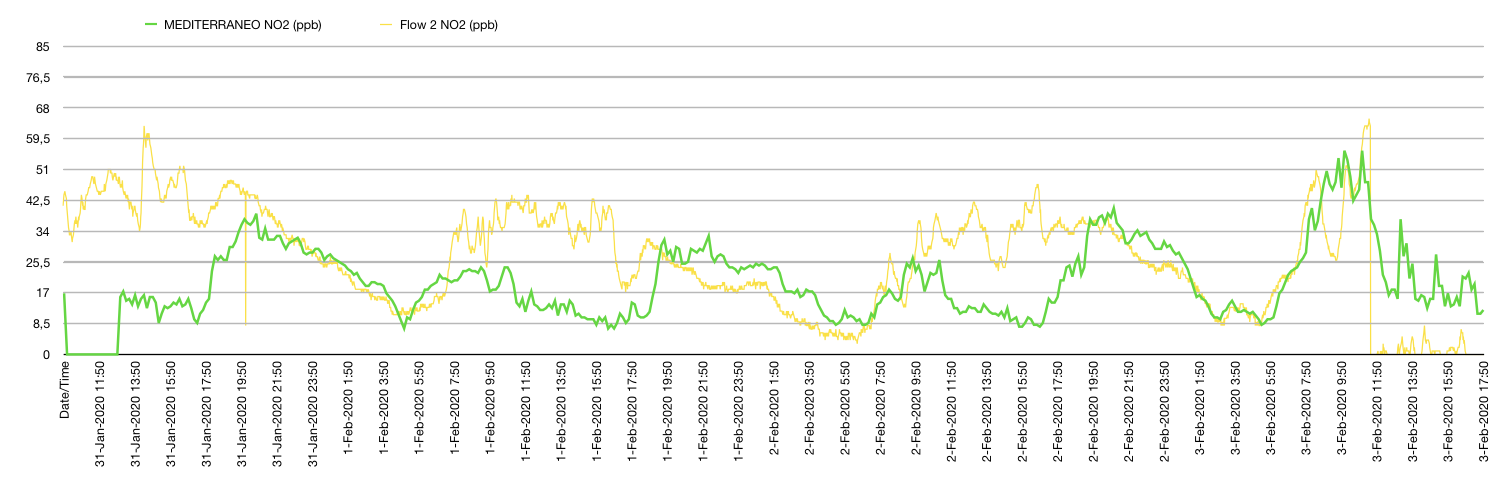
Let’s begin with the comparison of the NO2 gas sensor inside the Flow 2 and the reference monitor Teledyne Model 200E. The official measurements were in μg/m3 so I had to convert them into parts per billion (ppb). Converting the original values to ppb is not an easy task as you have to know the molecular weight of the pollutants (NO2=46.0055g/mol) and most importantly the temperature and atmospheric pressure at the time each value was taken, the problem was that they didn’t provide me with that data and I didn’t have them either. As a result, I looked them up and the average values were 15°C/59°F and 1019hPa, so to simplify my workflow I used those numbers in the formula for all the conversions. I know, I know, the data from the reference monitor are not 100% correct now but they are very close so they will do the trick.
Green: Teledyne Model 200E | Yellow: Flow 2
As you can see in the graph above there are quite many similarities in the trajectory of the lines. I was quite surprised and happy to be honest. You can clearly see how the low-cost sensor keeps getting exited from the pollutant(s) for a longer time but it was able to follow the official measurements. Keep that in mind, the official monitor Teledyne Model 200E worths around 8,000€ and Flow worths 159€.
Particulate Matter
Let’s continue our comparison with the Particulate Matter sensors from Atmotube Pro and Flow 2. Firstly, let’s see the PM10 measurements as the reference monitor Met One Instrument BAM 1020 (~18,000€) only provided the PM10 concentrations. The air inlet for the PM10 was about a meter away from where the 2 portable AQ monitors were placed and this is one of the reasons we can see that the concentrations from the BAM 1020 were much higher than the low-cost sensors.
Atmotube was able to follow the same trajectory as the BAM 1020 and when I multiply by x3.0 the output concentrations of the Atmotube the trend was much more similar (see graph below). On the other hand, Flow 2 was not able to keep up with the reference monitor. Flow’s (Yellow) line does not follow the reference monitor and I was unable to find any correlation.
Red: Atmotube Pro with amplified x3 PM10 output.
As the BAM PM2.5 measurements are being analysed in a lab right now in order to ensure accuracy by the state I will compare the result in a different post. They gave me an estimation of about a month.
Conclusion
It gives you a level of confidence to know that the little AQ monitor that you carry with you is able to reveal the truth about the air you breathe. Although the results are not perfect they can provide some general guidelines to the users.
Stay tuned for the final PM2.5 comparison, will Flow 2 have better PM2.5 measurements and will Atmotube Pro keep up?