There are countless times that I stretch the importance of monitoring and managing indoor air quality by keeping an eye on the outdoor air quality/conditions.
In this experiment, I want to demonstrate that it is hard to manage indoor air. I want to state that indoor spaces should be subject to 24/7 monitoring and not a periodic inspection.
The graph below demonstrated that indoor AQ gets influenced by outdoor air and on top of that, the polluted air lingers for a longer time indoors unless there is a mitigation plan (aka filtration) in place.
You probably have seen “cozy” images of fireplaces or wood stoves with happy people, a blanket around them, and a hot beverage and you may have thought that’s something very appealing, I want that! Well, I would suggest thinking twice before taking that decision and if you have already taken it, maybe it’s time to undo your mistake.
You see, people get sick thanks to these “cozy” elements in houses. It’s very hard to undo the brain wash the wood stove industry has done all of these years but we have to realize that wood burning is neither sustainable nor healthy.
Many claims that biomass is sustainable but this is a myth. A story designed to push people into spending money for status or simple ineffective heating. You see, clean energy (wind, solar, etc) doesn’t require the user to buy fuel, logs, or pellets every season. It is there for us but doesn’t generate constant revenue for the companies.
One will think that the more modern the house, the better the indoor air quality. However, that’s not always the truth as recently I discovered that many houses have inadequate appliances that will create harmful air pollutants and some of them will falsely mitigate contaminants by creating a false sense of remediation.
Example #1
Gas cooktops are a must according to good chefs as the pans are able to heat immediately and you have more control of the heat. That’s not true as the new induction cook tops are able to heat the bottom of the pans as fast without releasing harmful pollutants like Nitrogen dioxide.
Not lots of people are ready to accept the truth or understand it. We dismiss important information when it is not visible “out of sight, out of mind” and we get influenced when something is shiny and pretty.
Productivity
Poor air quality won’t kill you (at least not immediately and depending on the pollutants), but do you want to be an average employee, athlete, parent, student, or the best? Do you want your employees to work in mediocre conditions and perform poorly, or do you want them to be vibrant and productive?
In this article, you will find information about everything related to particulate matter. I will focus on PM2.5 as I believe it is the most universal indicator of air quality. Almost all scientific studies concentrate their attention to PM2.5 because there is a substantial availability of monitors/sensors. Some extracts were taken from my book See The Air – PROOF THAT AIR POLLUTION KILLS.
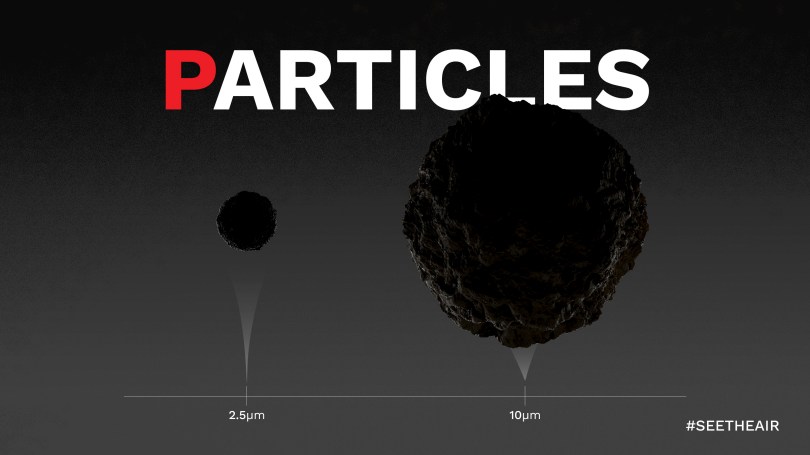
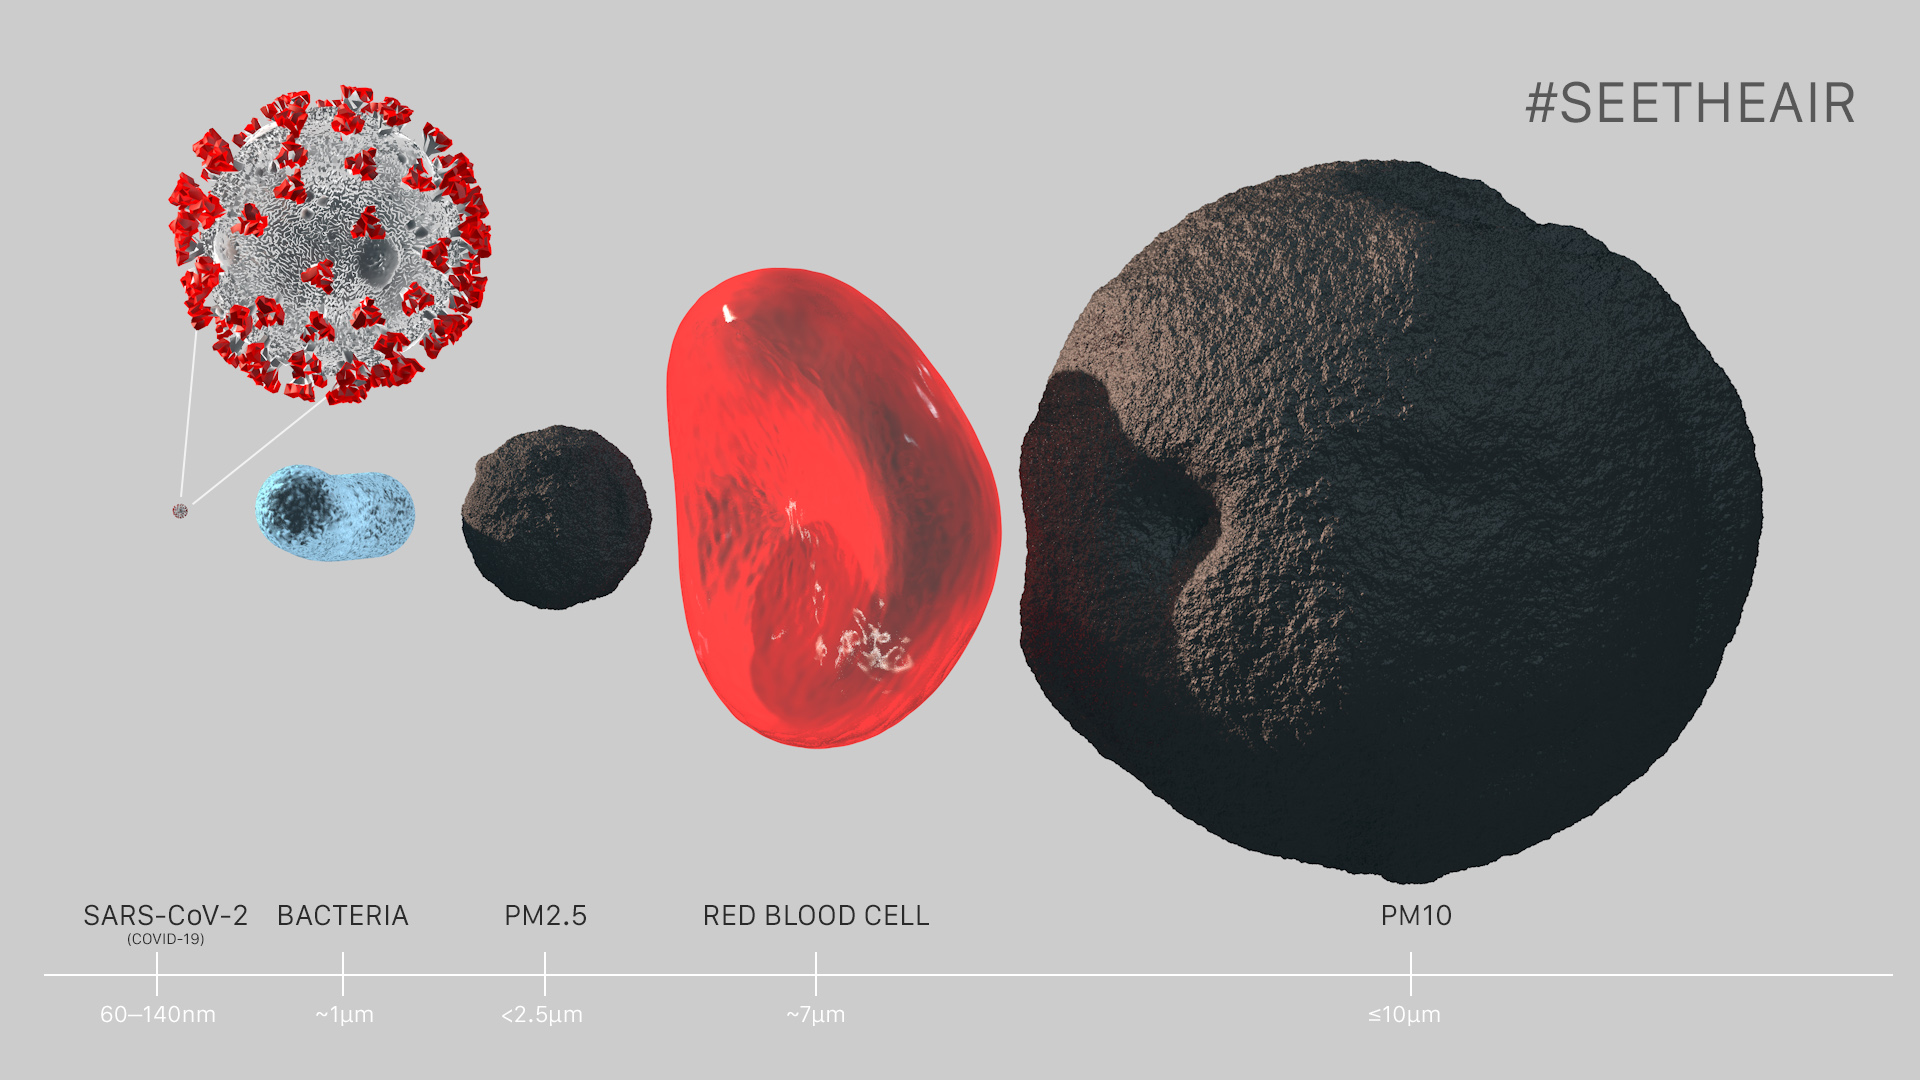
1) What is PM2.5?
Scientific explanation: PM2.5 is a mass concentration on basis of a separation curve, where the 50% value is at 2.5μm aerodynamic diameter. More precisely, the weighting function is much steeper (100% weighting <0.5μm, to 0% weighting> 3.5μm and 50% weighting at approximately 2.5μm). PM2.5 pollution can only be seen with an electron microscope.
Plain English explanation:PM2.5 referees to fine particles with a size of or less than 2.5μm (aka micron). By the way, soot, aerosols, dust, BC are other common terms to call particle pollution.
2) What is PM2.5 made of?
It is hard to determine a specific chemical composition, however, here is a list of all the chemicals that might be found in a single particle. Polycyclic aromatic hydrocarbons (naphthalene, acenaphthylene acenaphthene, fluorene, phenanthrene, anthracene, fluoranthene, pyrene, benzo(a)anthracene, chrysene, benzo(b)fluoranthene, benzo(k)fluoranthene, benzo(a) pyrene, dibenzo(a,h)anthracene, benzo(g,h,i)perylene, and indene), metals (Al, Si, P, S, CI, K, Ti, Cr, Mn, Fe, Ni, Cu, Zn, Pb, Ca), others.
The famous list with all the available indoor air quality monitors is finally updated. In this version there are two tabs. Air quality monitors for consumers (B2C) and for businesses (B2B). As always, I stay away from knockoffs and cheap products. An air quality monitor needs to function properly for 5 to 10 years depending the sensors − gas sensors tend to have a shorter lifespan.
Subscribe to download the Excel Spreadsheet.
If you want to download the Excel Spreadsheet with all the monitors you need to subscribe first. Thank you for your support.
I love spring as it marks the return of warm weather, outdoor activities, the blossom of flowers, and life in general. However, pollen becomes abundant everywhere there are plants and trees, as a result, the flare of allergy-related health issues too. I am allergic to some kind of pollen and although I can manage it without medication, some people are suffering to a greater extend and they need better ways to mitigate pollen out of their immediate environment.
Unfortunately, on earth, there are only a few special Air Quality monitors that can measure and classify pollen. Satellites also track the progress of pollen but do you know where to find this kind of information? I bet no, for this reason, I will tell you in a bit.
Remember, the first step is always quantifying the pollutants/allergens (pollen in this case) before mitigating them from indoor spaces. The reason is simple, once we have the proper information, we can take better decisions. For example, should I exercise outdoors today or go outside for some errands or is this the right moment to ventilate my house?
Nowadays, it is a privilege to have access to a real indoor environment where you can measure and quantify indoor environmental quality (IEQ). It is not an easy task because most companies keep AQ data private, and we totally respect that. However, sometimes tapping into the real world data is fundamental in order to understand the conditions white color employees and employers work in an effort to improve work conditions and productivity.
The owner of the building and the office granted me access to installing the Atmocube IAQ monitor for two months, in order to figure out what improvements shall apply in their effort to mitigate covid19, improve working conditions and boost productivity. The office is located in Almeria, Spain which is a coastal city.
They don’t have any mechanical ventilation systems, so the indoor conditions were subject to their human actions and whether they opened the windows/doors or not.
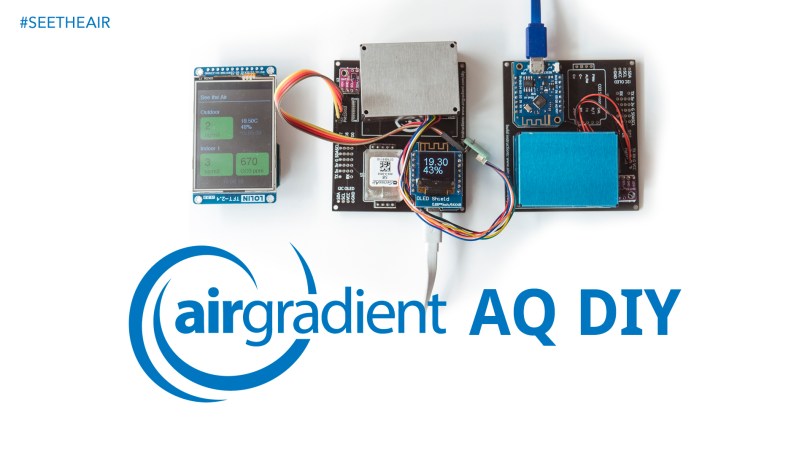
Countless times I have mentioned that we need to monitor indoor and outdoor air quality. This is an essential step in order to have a holistic approach to air pollution that surrounds us in both environments. Unfortunately, not everybody can afford to buy two monitors but thanks to the community and AirGradient there are two DIY solutions that can help us monitor the air quality quite accurately and of course, manage the air we breathe better.
AirGradient’s DIY solution is more appealing than the competition for many reasons. First of all, you can buy directly the DIY Kit with all the electronic components from them including the PCB. The PCB is the board where we will deploy all the sensors, WiFi module, and display. That is a huge benefit because you don’t have to search on the internet and purchase the components one by one. The well-designed PCB will also help us keep the monitor neat and small without unnecessary cables. Secondly, Air Gradient’s DIY AQ Monitor is very customizable allowing us to build an indoor monitor with an NDIR CO2 sensor but another one without a CO2 sensor or display for the outdoor environment. If you don’t want temperature/humidity sensors you can easily omit them too, but I highly recommend them. Moreover, there is software support as a community of passionate people have been improving the firmware constantly. Finally, the solution comes with a web dashboard where you can manage all the monitors and take advantage of the histograms and tools like the alerts.
Additionally, the devices which are connected to the cloud and the dashboard can broadcast the measurements back to a separate display (Viewport) which allows us to see the air quality indoors and outdoors like in the example below. Isn’t that very cool?
It has been a long time since I soldered something, so I was very happy to build the monitor. I built two monitors by following the fairly easy instruction here. There is also a video with the instructions here by Jeff Geerling.
In 2021, IKEA made available an indoor air quality monitor, which is very very affordable. I bought one because I was curious to answer some basic questions like how did they manage to build and sell a particulate matter sensor that costs only 14€ or US$12 but also how smart and reliable is it in relation to other monitors.
IKEA is obsessed with naming all their products with Swedish words, so the AQ monitor VINDRIKTNING (which I can’t pronounce) translates as Wind Direction. Obviously, they don’t aim to create names memorable to people’s minds.
Let me share a story with you. Long before covid19 (2018 if I remember well) I and a company I worked for, decided to pitch IKEA into building an AQ monitor as I saw their interest in air quality because they designed some photocatalyst curtains that neutralized VOCs back then. Unfortunately, they turned us down, but I think we planted a seed into them. Long story short in 2021 they released the VINDRIKTNING.