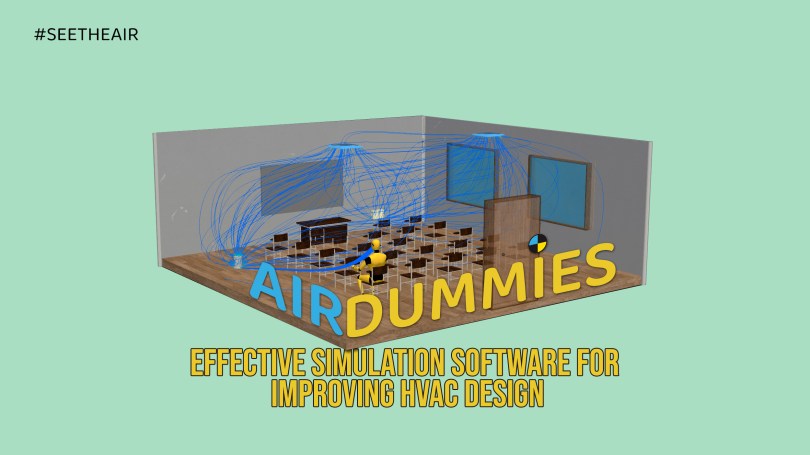
AirDummies emerges as a highly intuitive and powerful Computational Fluid Dynamics (CFD) software, purpose-built to demystify the complex world of indoor air dynamics. Designed with a clear focus on accessibility, it caters to a broad spectrum of users, offering invaluable insights into air patterns within diverse indoor environments, including school classrooms, offices, and domestic settings. Its ability to simulate everything from CO2 concentrations, particle contaminants, and temperature gradients to air velocity makes it an indispensable tool for optimizing comfort, health, and energy efficiency.
AirDummies is built upon the OpenFOAM open-source library. This foundational relationship means AirDummies leverages OpenFOAM’s extensive capabilities for simulating fluid flow, heat transfer, and related phenomena. By utilizing OpenFOAM, AirDummies benefits from a robust, well-validated, and continuously developed CFD engine, providing users with a powerful and flexible platform for their simulation needs.
Air pollution is an invisible threat, silently impacting our health. But what if you knew exactly where it lurked, both indoors and outdoors? Could an air quality expert, armed with this knowledge and personal equipment, achieve the World Health Organization’s (WHO) air quality guidelines for extended periods?
This is the question I, Sotirios Papathanasiou, an air quality expert, will try to figure out over the next year. Starting July 1st, 2024, I embarked on a unique experiment, tracking my personal air quality for a full year. I am monitoring two key air quality metrics: Carbon Dioxide (CO2) and PM2.5 (fine particulate matter). However, PM2.5 data will be excluded when relative humidity surpasses 70% because the limitations of low-cost sensors. I will be carrying an Atmotube Pro and an AIRVALENT everywhere I go.
I am your human guinea pig, carrying these portable air quality monitors everywhere – from my bedroom to my gym, from my kitchen while cooking to the beach on a weekend getaway. This comprehensive data will allow us to see if, despite my expertise in pollution sources and protective measures, I can consistently meet the WHO’s air quality guidelines.
There are countless times that I stretch the importance of monitoring and managing indoor air quality by keeping an eye on the outdoor air quality/conditions.
In this experiment, I want to demonstrate that it is hard to manage indoor air. I want to state that indoor spaces should be subject to 24/7 monitoring and not a periodic inspection.
The graph below demonstrated that indoor AQ gets influenced by outdoor air and on top of that, the polluted air lingers for a longer time indoors unless there is a mitigation plan (aka filtration) in place.
The aim of this paper is to give a review of the indoor environmental conditions in schools that are located in southern Spain as the climatological conditions tend to be middler and mechanical ventilated systems are not used in most cases either any kind of purification. There are many scientific papers that have documented the effects of indoor environmental quality (IEQ) upon productivity and performance within the workplace, but this paper is going to focus on the conditions and the means that are being used to control indoor air in public and private schools. Poor IEQ is known to be a factor causing health issues and has been connected with sick building syndrome (SBS) and reduced productivity (9% decrease) among white-collar workers through many studies. Covid-19 pandemic forced some schools to rethink the ventilation strategies but they rely heavily on window ventilation. This is an issue that persists in developing countries because of the lack of funds, however, it has not been given the attention it deserves in developed countries like Spain. Throughout this paper, we point out the main building factors which affect productivity (CO2, PM2.5, temperature, and humidity), without taking into consideration additional factors such as the effects of lighting and noise as they form part of the IEQ. Our main focus is to raise IEQ/IAQ awareness in places that are considered safe for the general public.
On 1st August 2021, I will attempt to travel from Spain to Greece in a hybrid car. I aim to reach my parent’s home (yes, I miss them a lot, damn you covid19) and then return to Spain by sea on a ferry.
It is a month-long road trip of about 3799 km (2360 miles) and I hope I will have the chance to meet new places and during this process, I will document the air quality/pollution in different countries/cities in my effort to raise awareness. I will carry with me a portable air quality monitor that measures, particulate matter (PM1.0/PM2.5), volatile organic compounds (VOC), temperature, and humidity. The monitor is the Atmotube Pro which I have already reviewed here and it correlates very well against reference monitors. Personal and 3rd party field evaluations reveal that the monitor correlates very strongly against GRIMM data PM1.0 r2 ~ 0.93, and PM2.5 r2 ~ 0.89 (1-hr mean). PM2.5 data against a FEM BAM correlate strongly as well r2 ~ 0.78.
I feel confident about the data that I will obtain and as the device saves everything on internal storage and in the phone with GPS coordinates, I won’t lose anything and I will be able to answer some questions, like which counties are more Air Quality friendly based on my data, what was my average exposure to PM during the trip in total and in different countries, or if I had stayed at home, would I have been exposed to less PM, etc. Let’s find the Mediterranean country/city with the cleanest air.
I will visit some cities in Spain, France, Monaco, Italy, Slovenia, Croatia, Bosnia and Herzegovina, Montenegro, Albania, and Greece.
Stay tuned on social media like Twitter and Instagram, as I will post very frequently photos of the trip with AQ data and comments!
Wish me good luck and if you are interested in learning about the air quality in one of the places I will visit or you have any questions please write below.
I am the kind of person that likes things organized and always planned. During the pandemic, I took up hiking as a new hobby. I spend a lot of time indoors working in front of the computer, so I decided that it was time to find an activity in nature where I will be able to look as far away as possible in order to extend my view field and exercise my eyesight. The location I live allows me to do that hobby reality but air quality is not always optimum.
As you may know, I live in southern Spain and although traffic pollution is an issue, when I hike in the hills there is a different type of pollution that may be present, the Saharan Dust. In 2021 I have noticed that cross-border pollution events are more frequent. There are no constant warnings from local media or local authorities about these kinds of events. Newspapers or TV news will only mention them only when there is nothing else to talk about.
So when I want to go outside and practice that sport, I check not only the weather forecast but the air quality forecast from various apps and web services. In this article, I will compare three air quality services and apps that I mostly use and see if they offer an accurate forecast. The apps are eLichens Air, Plume Labs, and Windy.
The method is simple. The night before hiking, I check the AQ forecast with these three apps, and then the next day I check the actual AQ measurements from my sensors and the apps again.
Friday Night 7-May-2021 | Forecast
Saturday Morning 8-May-2021 | Real-Time
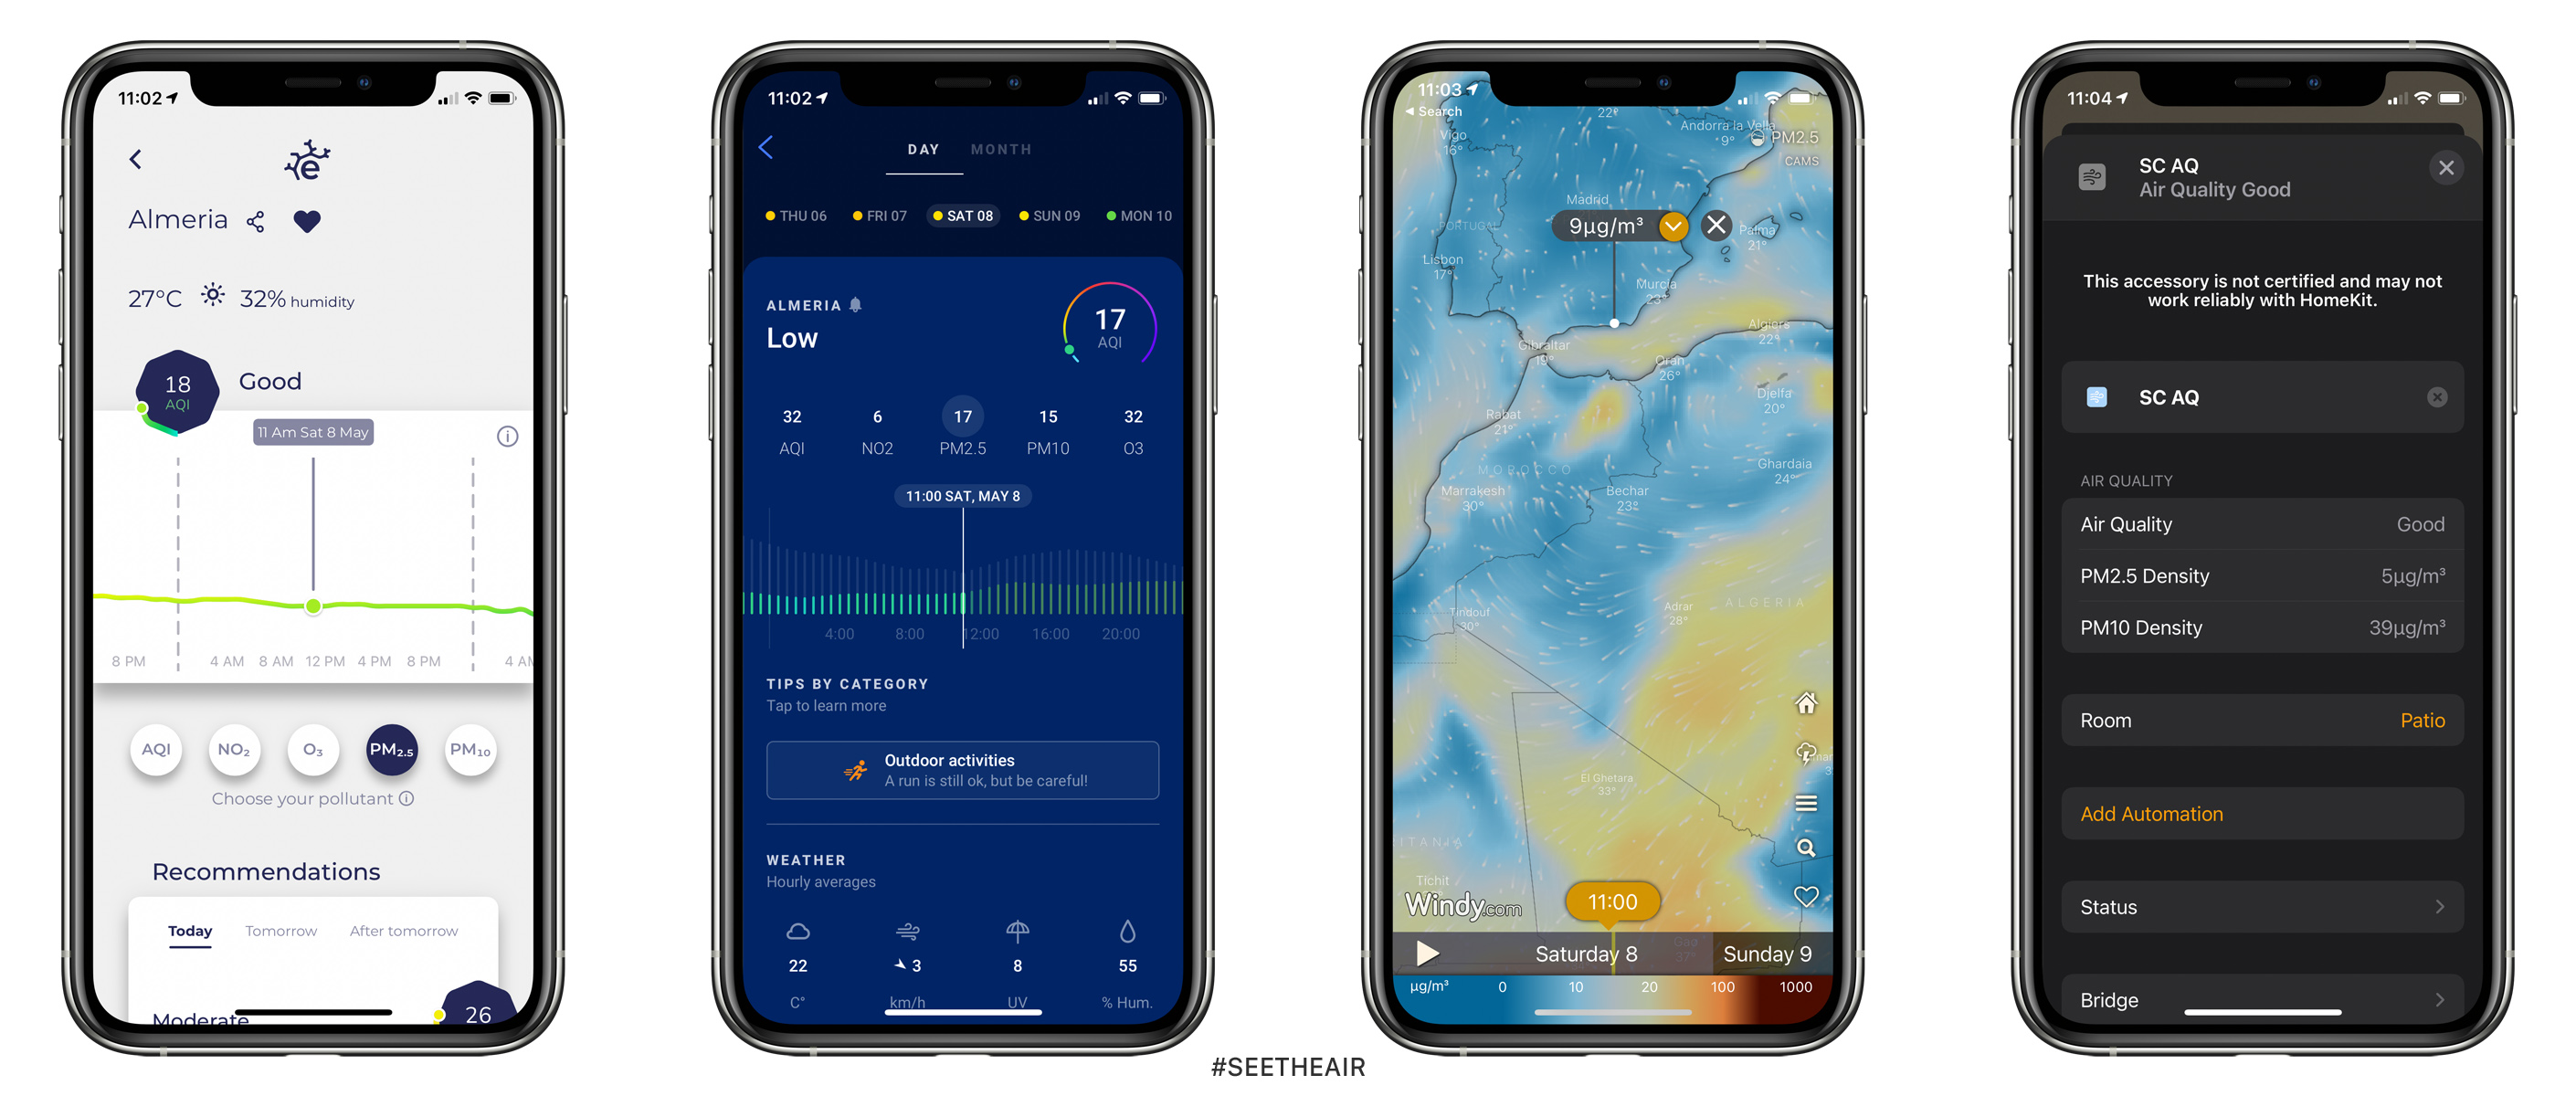
Here is the first comparison. At night of Friday 7th May, I checked the AQ for the next morning at 11am. The forecast data predicted by the Plume Labs and the eLichens Air show an index value and not a mass concentration (μg/m3) like Windy does. In most cases companies use a proprietary AQI and in order to be able to compare them I will need to “decrypt” them. I wasn’t able to find any documentation for the eLichens Air AQI.
Plume Labs gave me an AQI 21 for PM2.5 which according to their documentation corresponds to a value below 25μg/m3. eLichens Air gave me an AQI 16 for PM2.5 which I estimate it corresponds to a value below 12μg/m3. Windy estimated 8μg/m3.
The following day, I checked the measurements at the exact time like the night before plus the real-time values from my outdoor sensors. PM2.5 values were at 5μg/m3 and the eLichens Air, Plume Labs, and Windy gave me almost the same values of 9μg/m3 and 17/18 AQI which are roughly the same.
Saturday Night 8-May-2021 | Forecast
Sunday Morning 9-May-2021 | Real-Time
The second test revealed similar PM2.5 forecast values (20 AQI) between the Plume Labs and the eLichens Air and an estimated value of 14μg/m3 from Windy.
The following morning, the real-time values from the apps were far different from the in-situ values as my outdoor sensor measured 4μg/m3 and the apps gave me a value of 15 AQI and 16μg/m3.
Conclusion
In their defense, there are not lots of available data here because our local AQ station doesn’t share openly PM2.5 data. So they work with models that are not able to give better results. In different parts of the world where spatial coverage is better and official stations share PM2.5 values with the public, they have better results. Some apps rely on satellite imagery, but again satellites pass over Spain once a day and they have a 3.5km by 5km resolution like the sentinel-5 precursor (my favorite so far). I take them into account to make a rough estimation of the following day and of course, I check the data from my local outdoor sensors.
After almost two months of asking local schools for permission to install air quality monitors in their classrooms, on the 4th of December, a local school decided to grant me access.
In my city, Almeria, Spain, there are about 110 schools. I didn’t apply to all of them because each time I managed to find a way to contact them, I had to arrange a meeting in order to explain to them what I wanted to do, and all this process takes time. I managed to contact nine schools.
For this study, schools didn’t have to pay anything, so money wasn’t the issue for their refusal. They were worried about what will happen if the results were disappointing and negative. I tried to explain to them that the aim of the study is to understand what is going on in the classroom, in real conditions, with real students. I don’t want to discredit the school either the local authorities that manage the budget for the school. For this reason, I will keep the name of the school private.
Monitors
The monitors that I have installed for the study are made by Airthings. There are two Wave Plus, which include a CO2 sensor by Senseair. The sensor is called Sunrise, and it is an ultra-low-power, high precision NDIR sensor. Accuracy (CO2) ±30 ppm ±3% of reading. Finally, it features a self-correction system that allows them to auto-calibrate every 180 hours. I also have included a Wave mini monitor in the teacher’s office room.
Have you ever wondered how to use the RGB LED bulb you have purchased in a more productive way? Sure, you can control the lights via your phone but this is not “smart” plus if you manage your lights with your phone it may take longer to turn off and on a light fixture than just by hitting the switch.
The obvious is to set up a visual (light) indicator each time the air quality is poor in your house, for example, when PM2.5 is high, then the lights flash twice with orange colour. However, the ultimate way to give real value to a smart light bulb is when the combination of an AQ monitor and a light bulb can save your life in a real-life threatening situation. How?
I managed to grant permission from the local authorities (Junta de Andalucia) here in my city Almeria to place two low-cost monitors among the reference instruments in order to determine whether the two consumer products could offer fair readings to the users.
After filing some paperwork and the help of the responsible people in my city, they granted me access to the reference Monitor ES1393A (Mediterráneo) that complies with all EU standards. It is a quite powerful station as it is equipped with many expensive instruments (figure 1) which measure many types of pollutants, such as Nitrogen Oxide (NO), Nitrogen Dioxide (NO2), ground-level Ozone (O3), Carbon Monoxide (CO), Sulphur Dioxide (SO2), PM10, PM2.5 and many more.
The portable consumer-grade monitors that I placed in the reference AQ station were the Atmotube Pro and the Flow 2. Of course, I placed them outside the station and I attached them to the PM2.5 beta attenuation monitor air inlet (as you can see in figure 2) because I wanted to ensure the greatest PM2.5 correlation possible.
A beta attenuation monitor (BAM) is a universally used air monitoring technique that employs the absorption of beta radiation by solid particles extracted from airflow. This technique allows for the precise detection of PM2.5 without humidity affecting the results (a common problem for the laser scattering sensors). However, there are some drawbacks, for instance, it doesn’t provide data in real-time and it takes only a few measurements in an hour.
Figure 1: Air Pollution Monitors
Figure 2: BAM air inlet and Portable AQ Monitors
The portable monitors took measurements continuously for three and a half days with an interval of 1 minute between each measurement. The reference monitors took measurements every 10 minutes, so the data from the reference monitor are not as dense as from the Atmotube and Flow but are much more accurate and even without the same density we will be able to get a good idea of what is going on.
Before presenting the results from this comparison, I would like to mention that my measurements cannot be taken as a “de facto”. In order to determine the real correlation of a monitor or a sensor, you need at least 3 units and various days to months of data. Maybe some other units from both parties, PlumeLabs and Atmotube, may give different results. The climate also affects the performance of the sensors, so a different geographical location can give us different results.
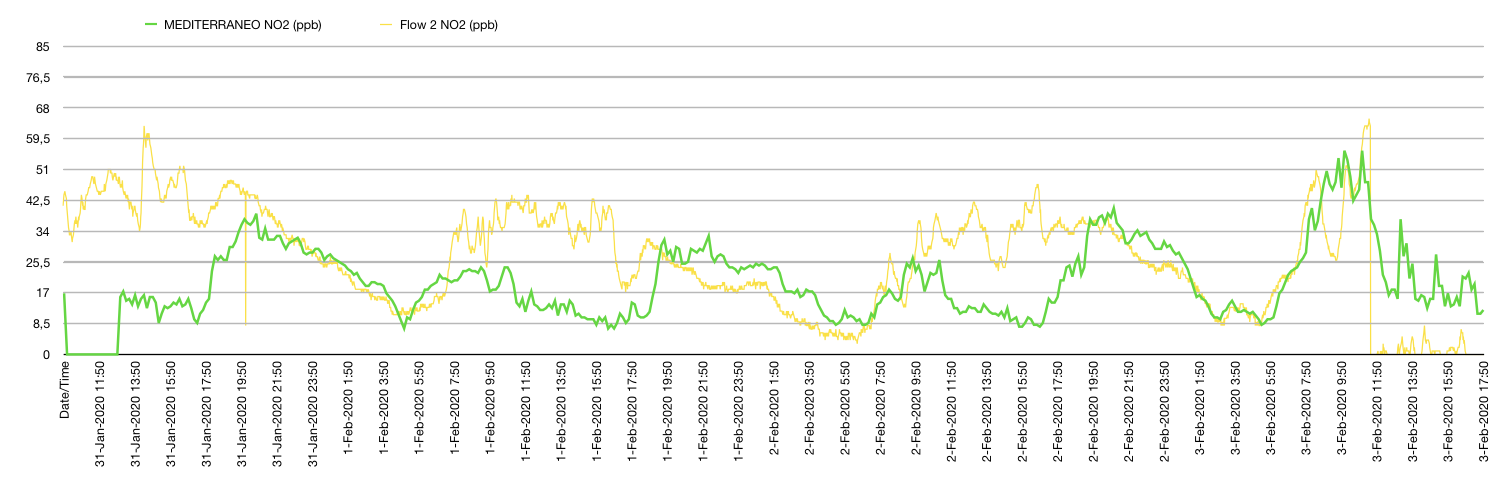
Nitrogen Dioxide
Let’s begin with the comparison of the NO2 gas sensor inside the Flow 2 and the reference monitor Teledyne Model 200E. The official measurements were in μg/m3 so I had to convert them into parts per billion (ppb). Converting the original values to ppb is not an easy task as you have to know the molecular weight of the pollutants (NO2=46.0055g/mol) and most importantly the temperature and atmospheric pressure at the time each value was taken, the problem was that they didn’t provide me with that data and I didn’t have them either. As a result, I looked them up and the average values were 15°C/59°F and 1019hPa, so to simplify my workflow I used those numbers in the formula for all the conversions. I know, I know, the data from the reference monitor are not 100% correct now but they are very close so they will do the trick.
Green: Teledyne Model 200E | Yellow: Flow 2
As you can see in the graph above there are quite many similarities in the trajectory of the lines. I was quite surprised and happy to be honest. You can clearly see how the low-cost sensor keeps getting exited from the pollutant(s) for a longer time but it was able to follow the official measurements. Keep that in mind, the official monitor Teledyne Model 200E worths around 8,000€ and Flow worths 159€.
Particulate Matter
Let’s continue our comparison with the Particulate Matter sensors from Atmotube Pro and Flow 2. Firstly, let’s see the PM10 measurements as the reference monitor Met One Instrument BAM 1020 (~18,000€) only provided the PM10 concentrations. The air inlet for the PM10 was about a meter away from where the 2 portable AQ monitors were placed and this is one of the reasons we can see that the concentrations from the BAM 1020 were much higher than the low-cost sensors.
Atmotube was able to follow the same trajectory as the BAM 1020 and when I multiply by x3.0 the output concentrations of the Atmotube the trend was much more similar (see graph below). On the other hand, Flow 2 was not able to keep up with the reference monitor. Flow’s (Yellow) line does not follow the reference monitor and I was unable to find any correlation.
Red: Atmotube Pro with amplified x3 PM10 output.
As the BAM PM2.5 measurements are being analysed in a lab right now in order to ensure accuracy by the state I will compare the result in a different post. They gave me an estimation of about a month.
Conclusion
It gives you a level of confidence to know that the little AQ monitor that you carry with you is able to reveal the truth about the air you breathe. Although the results are not perfect they can provide some general guidelines to the users.
Stay tuned for the final PM2.5 comparison, will Flow 2 have better PM2.5 measurements and will Atmotube Pro keep up?
I am sure you all have heard that we spend 90% of our time indoors, as a result we have to create a healthy environment if we want to stay healthy and strong. Although I am very tired of hearing this expression, it is true, most of us spend that 90% indoors but not only inside our house. Inside our houses we spend about 60% of our time, cooking, cleaning, sleeping/resting, having fun with our loved ones and reading.
In this experiment, I want to demonstrate what academic studies have already proved that when we cook we deteriorate the air quality inside our house. Remember we eat at least twice a day and probably we have to cook twice a day as well.