We live in an era of hyper-quantified health. Every morning, millions of us check our wrists to see how we slept, what our resting heart rate looks like, and how many steps we logged yesterday.
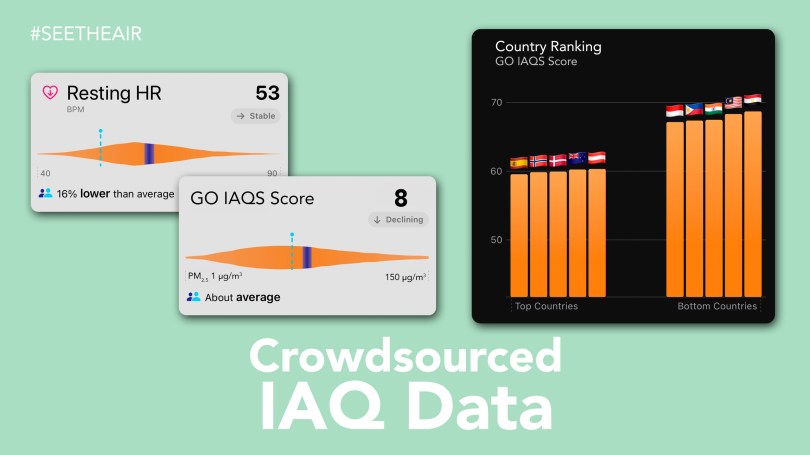
Apps like Health Hive have revolutionized this experience. By taking biometric data from tools like the Apple Watch and anonymously pooling it across a massive database of over 65,000 active users, they give us a powerful, context-rich mirror. It’s one thing to see your Resting Heart Rate (RHR) is 53 BPM; it’s an entirely different, highly motivating thing to open Health Hive and see a bell curve showing you are lower than 86% of similar users in your 40–49 age demographic.
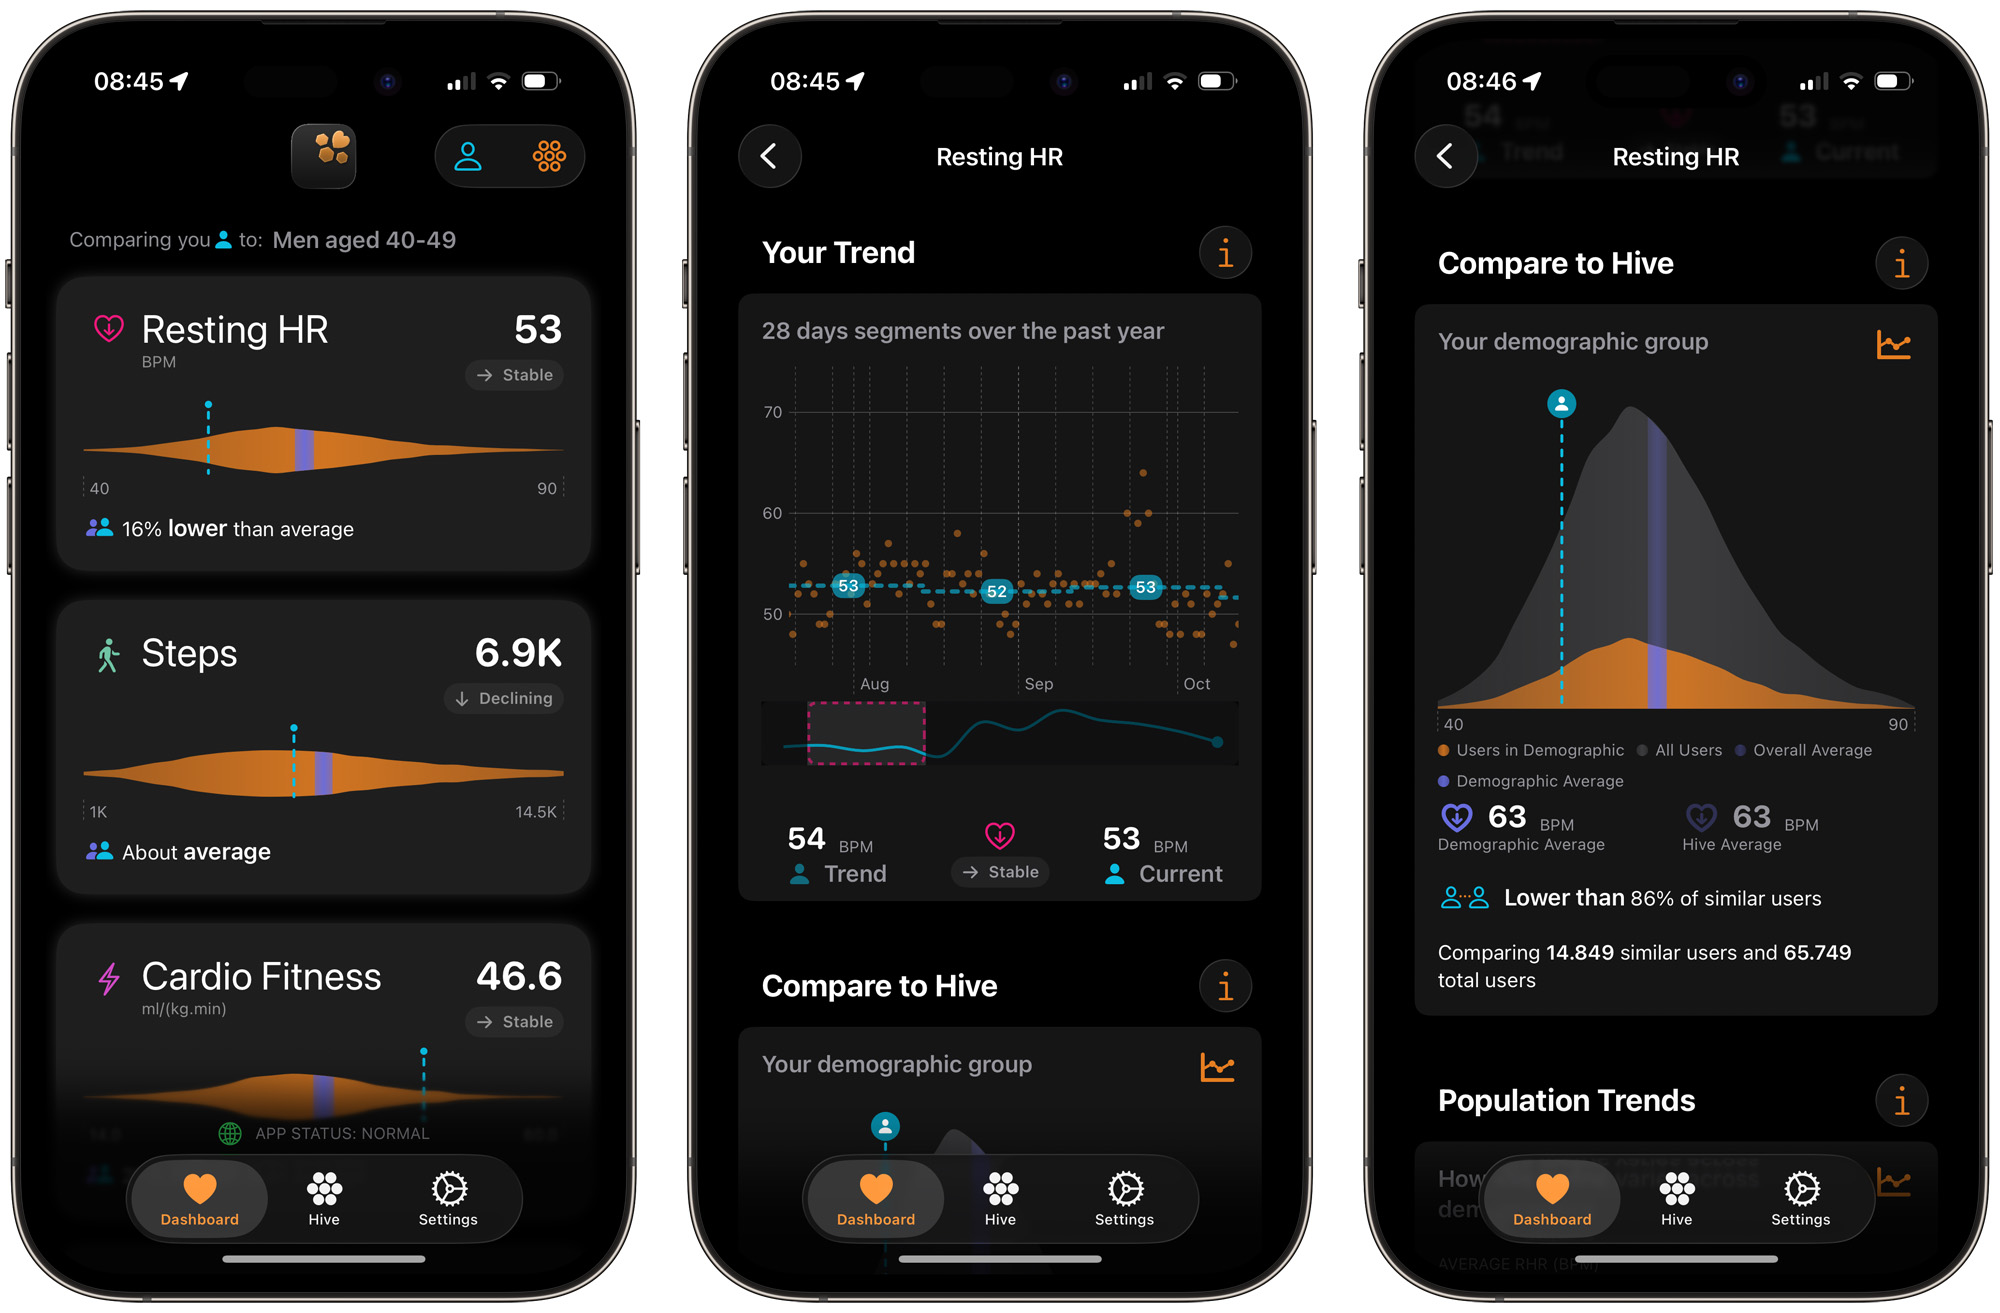
Suddenly, you aren’t just looking at an isolated number, you have community context. You know exactly where you stand on the path toward your longevity goals.
But as a culture obsessed with wellness, we have a massive, invisible blind spot.
We meticulously track our cardio fitness, hit our step targets, and optimize our sleep cycles. Yet, we completely ignore the 11,000 liters of air we breathe every single day. We spend roughly 90% of our lives indoors, where the air can be significantly more polluted than outside. If we want to unlock true health, it is time to take Health Hive’s population-comparative approach and apply it directly to our indoor air quality (IAQ).
The Danger of the “Longevity Silo”
Humans suffer from a psychological glitch when it comes to healthy living: we tend to hyper-focus on one habit while completely ignoring everything else.
You can eat an organic diet, hit your 10k daily steps, and boast an enviable athletic resting heart rate. However, that hard work is actively undermined if you are sitting in a stagnant room breathing in high levels of fine particulate matter (PM2.5) or volatile organic compounds (VOCs) for 22 hours a day.
The ironic truth is that we are the primary polluters of our own indoor spaces. Think about your daily habits:
- Cooking: Frying or gas-stove cooking without heavy ventilation spikes localized air pollution to industrial levels.
- Ambiance: Burning scented candles floods the air with ultra-fine soot.
- Perfumes & Cleaning: Spraying perfumes and using harsh chemical cleaners incorrectly creates chemical clouds that linger in our carpets and upholstery.
Because air is invisible, we don’t realize we are doing it. We desperately lack a behavioral feedback loop. This is exactly where community-driven statistical data can step in to spark a reality check.
Moving Beyond Simple Sensors: The First Layer of Comparison
Right now, a standard consumer air quality monitor tells you a raw number, for example, your PM2.5 is 26 μg/m3. To the average person, that means nothing. Is it bad? Is it normal for an apartment?
By applying the Health Hive framework to indoor environments, we can build a baseline “first layer” of comparison. Instead of an isolated reading, an air monitoring platform could cross-reference your home with regional and global data to answer critical, practical questions:
| The Question | The Power of the Crowd |
| How does my apartment compare to my city? | Realizing that your home has double the pollution baseline of your neighbors, indicating a severe ventilation defect. |
| Why is particulate matter so high right now indoors? | Seeing a localized spike that your peers don’t experience, proving that a specific habit, like burning candles or poor cooking ventilation, is the culprit. |
| Why is my city’s air worse than another? | Using macro trends to understand how regional smog, weather, or urban density affect your indoor baseline. |
When you see a visual dashboard ranking showing that your living room’s air quality sits in the “worst 10% of your neighborhood,” it triggers an immediate psychological shift. It moves air quality out of abstract science and into personal accountability. You change how you clean and you turn on the range hood.
Expanding the Model: Rankings and Health Correlations
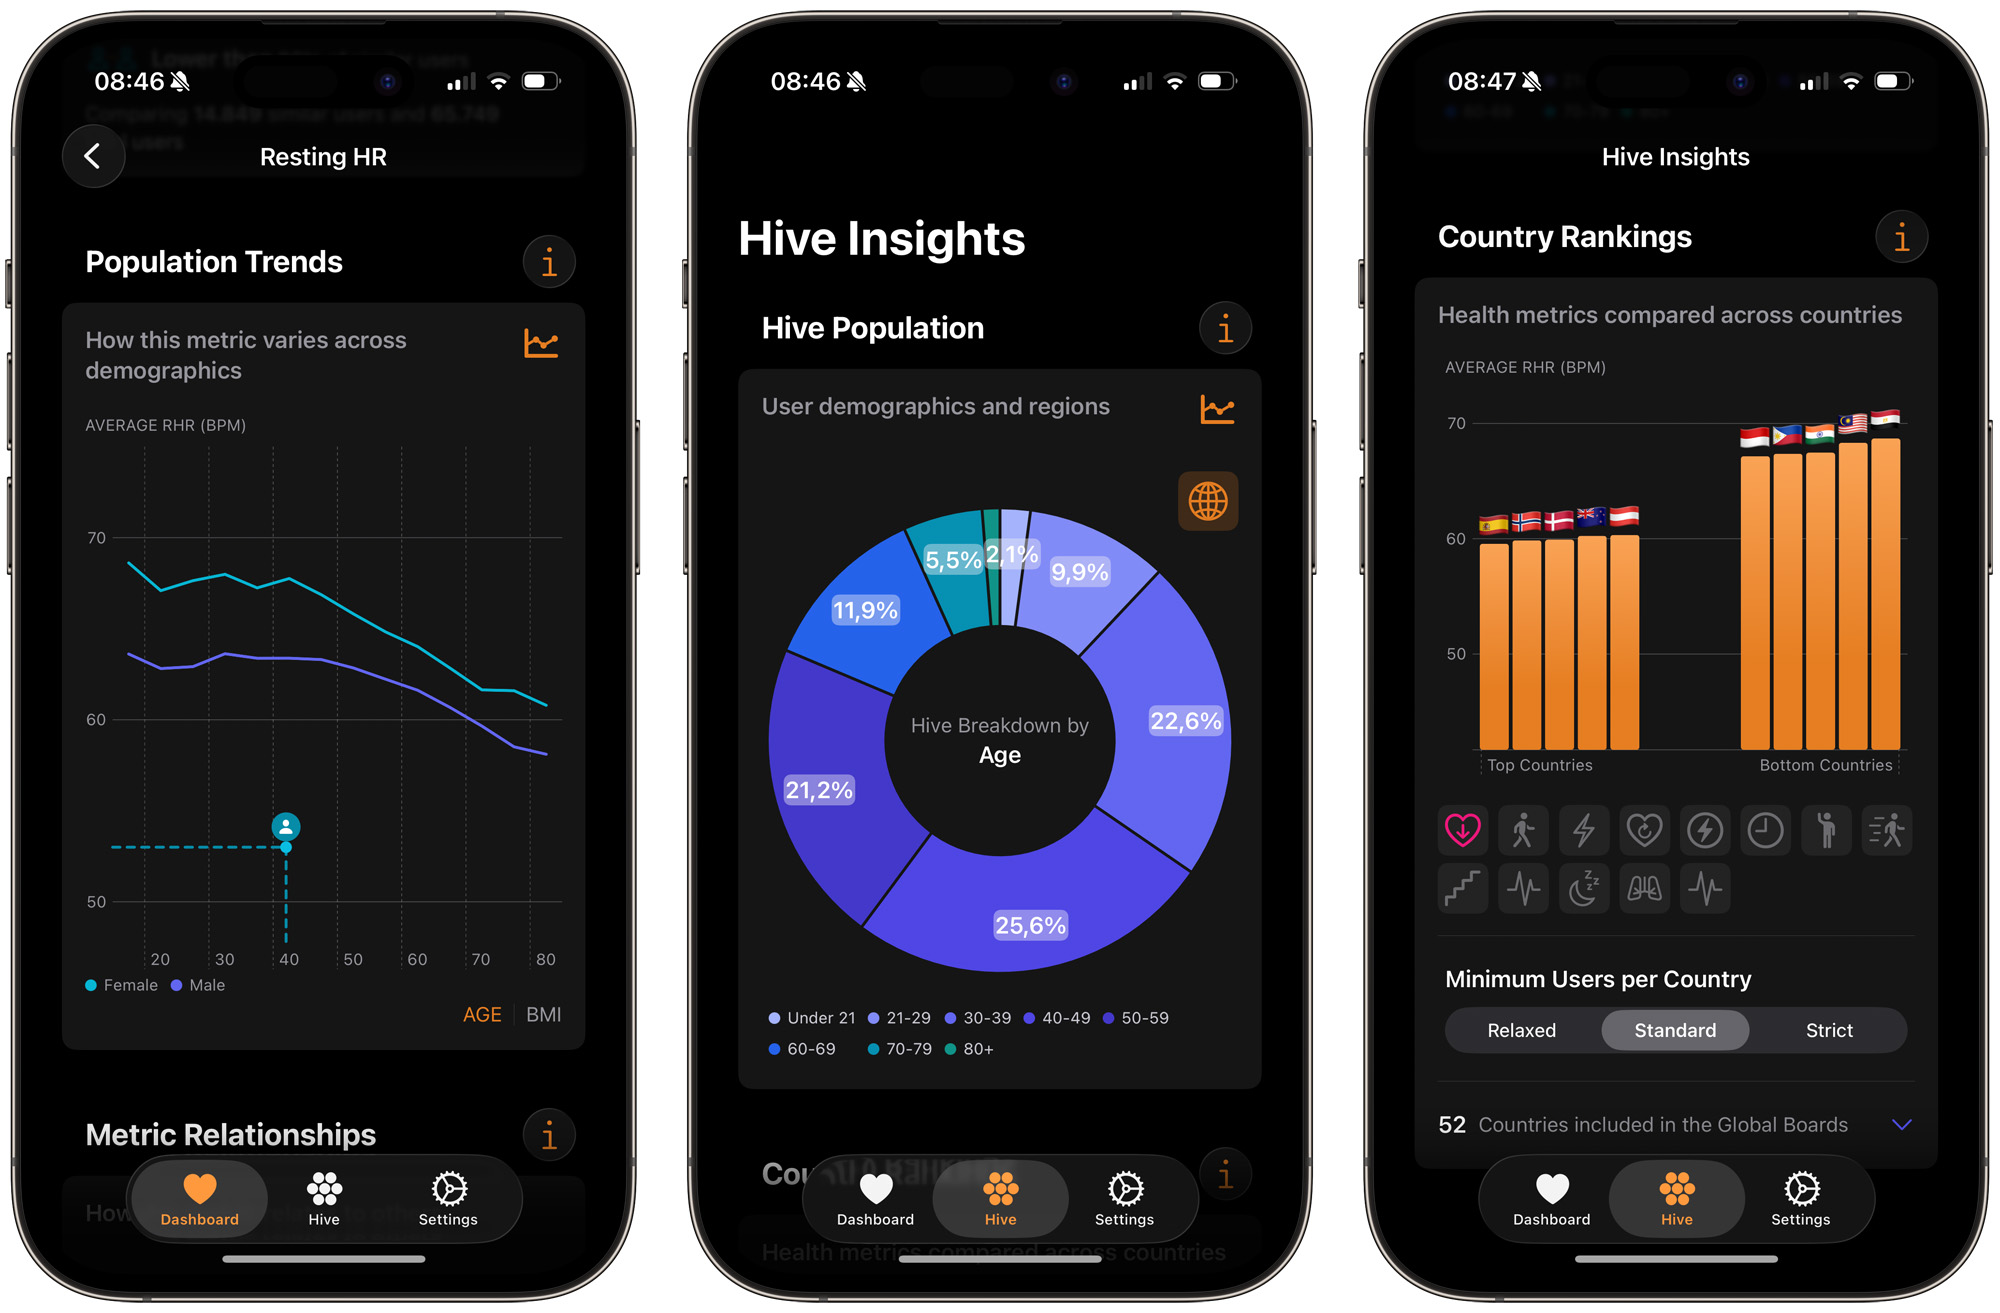
The true genius of a crowdsourced health app lies in its advanced layers. Health Hive doesn’t just show your personal trend lines; it features Country Rankings, allowing you to see global macro-trends, like which parts of the world boast the best breathing rates or lowest resting heart rates. Applied to IAQ, this would allow us to rank building health standards across different cities, states, and nations, holding real estate and local environments accountable.
Furthermore, it opens the door to correlation analysis. Just as a health app allows you to analyze how your breathing rate maps against your heart rate or how sleep duration affects workout endurance, an integrated environmental platform could cross-examine the air and the body.
Imagine a secure, anonymized model where your home’s air monitor talks to your wearable health data:
Spike in Bedroom CO2 or PM2.5 –> Elevated Sleeping Heart Rate –> Drop in Cardio Endurance
When people can mathematically see that a poorly ventilated bedroom directly degrades their sleep quality and resting heart rate, a foundational metric for longevity, indoor air quality will finally get the priority it deserves.
We don’t need to start with hyper-complex medical models. We just need to start with simple, transparent layers of comparison. By letting us see how our spaces stack up against a pool of thousands of others, we can finally visualize the invisible, and change our behavior for good.
Discover more from See The Air
Subscribe to get the latest posts sent to your email.
