Here are all the available IAQ Monitors on the market. This time and after your help I have included many more information in a Google Spreadsheet document which you are going to appreciate a lot, such as website links and whether the device has been reviewed on my blog or not yet. There are so many devices out there but they all lack innovation and they all offer exactly the same technologies. Companies had better hear users feedback!
A USA air quality monitor in comparison with a DIY German air quality monitor. How well do they perform with each other? Full disclosure, the software the monitors run is developed in the mentioned countries. The components from both devices are made mostly in China.
We already know PA-II’s correlation of coenficency R²≈0.87 with the corresponding FEM GRIMM and FEM BAM.
The SDS011 sensor which is most commonly used in the Luftdaten project has a correlation of coenficency R²≈0.84.
The PA-II features a double PMS5003 laser sensor. The PA-II module averages out the values from the two sensors, so in case one of the two sensors registers unexpected high readings, (perhaps some dust or insects etc) this technique makes the readings less questionable. The Luftdaten DIY project as we have mention above mostly uses one SDS011 laser sensor. However, the Luftdaten software supports many PM2.5 sensors including the PMS5003 series among others.
Analysis
My friend Ashley from Plume Plotter has already done a comparison between the Purple Air PA-II, the Luftdaten SDS011 and DEFRA for a complete year of data link.
First of all, by comparing PA-II’s two identical sensors we can see on the graph below that the Sensor B has the tendency to register higher concentrations over time, on my device, maybe another device has a different behavior. So the process of averaging out the concentrations from both sensors has some positive results.
Many scientific papers insist that the PMS5003 and SDS011 sensors are nephelometers and not particle counters. Which means that they are influenced by humidity. Nephelometer comes from the compound Greek word nephelo “Νέφος” which means cloud.
I live in an area with high humidity. Right now the official RH is 83%. The PA-II registers 51.6μg/m3 and Luftdaten 38.3μg/m3. The difference between them is huge. However, both devices are mistaken. Purely for your information the humidity sensor in the Luftdaten device measured RH 94% the PA-II measured RH 53% and AirVisual measured RH 72%. From my experience, I would say that the relative humidity is definitely above 80%.
From the graph below we can see the same results. The PM-II overestimates the PM2.5 concentrations most of the time in comparison with the Lufdaten sensor. Both devices seem to measure the same fluctuations over time so there is some correlation. The humidity that day started low at RH 30% and climbed up to 60% at the end of the day. There is an influence between humidity and how the sensors and especially the PA-II measure PM2.5 concentrations without any doubt.
SeeTheAir: 24h PA-II & Luftdaten side by side
Conclusion
The conclusion that I get from my everyday readings having the two devices side by side and from Plume Plotter’s analysis is that the PA-II overestimates the PM2.5 concentrations especially when relative humidity is above ~55% while the Luftdaten’s readings are more adjacent to the official readings.
Plume Plotte: Regression lines for Luftdaten sensor and Purple Air PA-II sensor readings vs. actual (reference instrument) concentrations.
A reader of the blog took the initiative to establish a contact between PurpleAir and me, as a result the PurpleAir II outdoor Particulate Matter monitor is here for a review. Thank you Daniel.
The monitor is very compact and it can be easily distinguished from the rest because it has 2 Particulate Matter sensors. Both of them work together to establish better results and a coefficient of determination (R²).Read More »
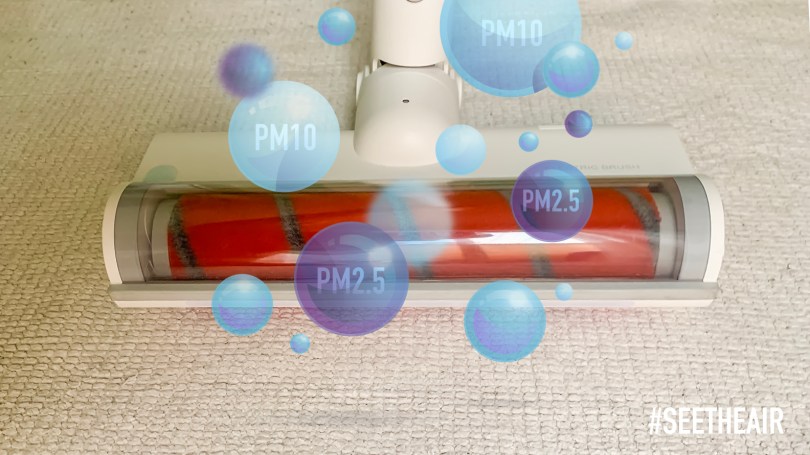
We all enjoy a clean and cosy house free from dust and pollutants. Unfortunately, sometimes we commit serious mistakes when it comes to the decisions we take and the ways we choose to clean it. One of the most common mistakes is using vacuum cleaners that don’t have a HEPA filter. We already know how dangerous are PM2.5 particles because they can penetrate deeply inside our bodies and affect our lungs, heart and even our brains.
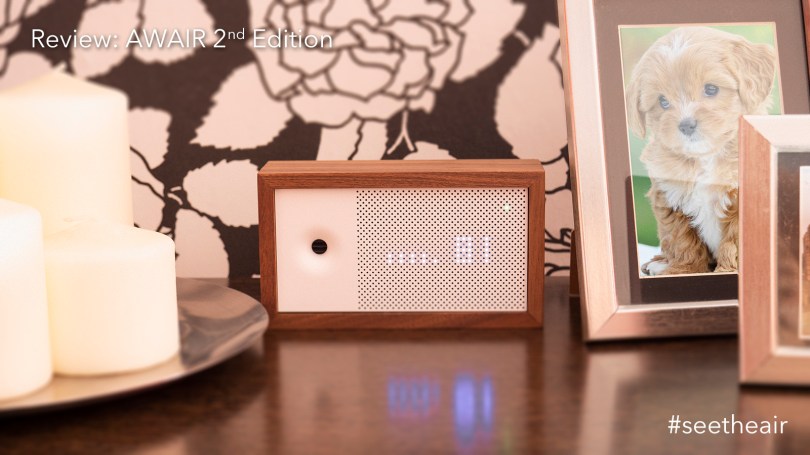
I love when companies manage to release a second generation of their original product. In this case, Awair released the new Awair 2nd Edition a few months ago.
They clearly have learned a lot and the adjustments they have done and offer with the new version are notable at least hardware-wise. Software-wise the tweaks are small in comparison with the old version but welcome. This can be a good thing because old users can enjoy similar features like the new ones.
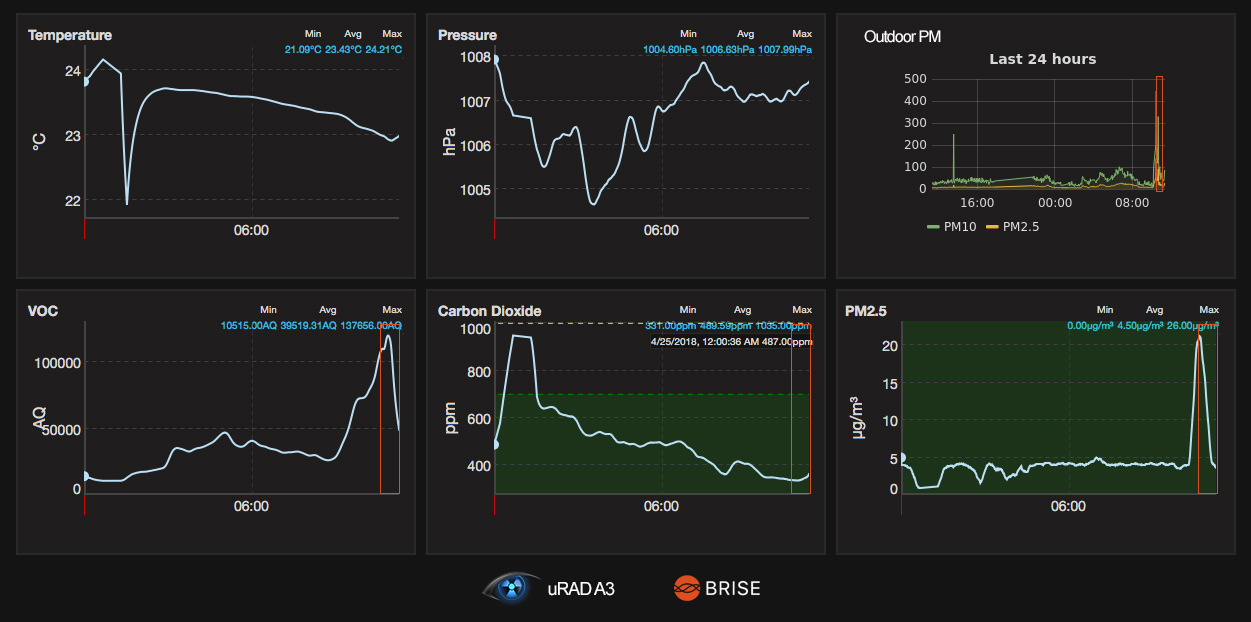
On the previous article, I presented a new air purifier with an A.I. Engine called BRISE C200. In general, the best way to prove the efficiency of an air purifier is by taking measurements with a respectable 3rd party AQ monitor while there is an air quality issue ongoing inside the room and that is what I did. I used the uRAd A3 Monitor for the measurements and the device was placed near the purifier.
At first, I had set the purifier off on purpose because I didn’t want the A.I. engine to kick in automatically before I was able to register the event. When a PM2.5 spike was registered, as you can see on the picture below from 4μg/m3 to 26μg/m3, I turned on the purifier and the air quality inside the room immediately improved till it returned to the normal PM2.5 concentration and the purifier turned itself off automatically.
In the picture below you can see the FC200 4-in-1 Combo filter after one month of usage. The carbon pre-filter has captured PM10 particles, hair, dust and even a little dead spider, which was caught by the purifier’s air flow when it was set on Turbo Mode. After that, we can see the blue anti-bacteria filter and under it the HEPA filter responsable for capturing all PM2.5 particles. Finally, the TiO2 will absorb harmful chemical vapors.
I wanted to repeat the experiment with the BRISE C200 purifier and a different AQ Monitor in a different room and day, so with the help of the AirVisual AQM I set them up in my bedroom. This time it took 14 min into Turbo Mode to clean the air, the bedroom is a bit bigger. When the purifier achieved a concentration of ±1μg/m3, I turned it off and with the door closed the air inside the room was kept clean, but immediately after I opened the door the air quality was decreased. Below you can see the results.
It was time to review an air purifier because it is a vital device for those who suffer from air pollution and allergies. The purifier that I am going to review is called BRISE C200. It was first launched in Taiwan in 2017, although the company’s headquarter is in the Netherlands with team members in Germany and Taiwan. I have been following this company since their first steps into the air quality market.
The reason I wanted to review this purifier first is because it is the first air purifier with artificial intelligence aka A.I. and because it combines two devices in one, an air quality monitor and a purifier, obviously.Read More »
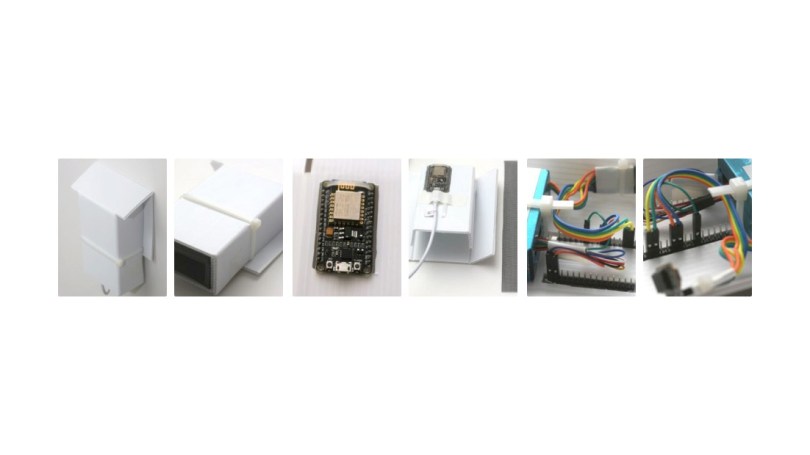
Who says that everything is made in China or USA? Well, let me introduce you the uRAD Monitor A3 an Air Quality Monitor which is made in Romania, Europe since 2012. The design, firmware design, server software and big data database maintenance and development are all made there and amazingly enough even the unit that I have on my hands is made personally by the CEO Radu Motisan. As a result I am very proud to review it and talk about the cons and pros.
The new version offers a low cost housing and the software is more mature now. The software is open source, on github, and there are some pre-built images on their website.
A great new feature is the ability to store of a few days of data on the device which makes it more robust to internet outages and usable for periods away from wifi access, and it records every sample from the PMS5003 sensor which is more that one per second to better capture quick changes and better for mapping walking around.
You can find all the instructions on their website.
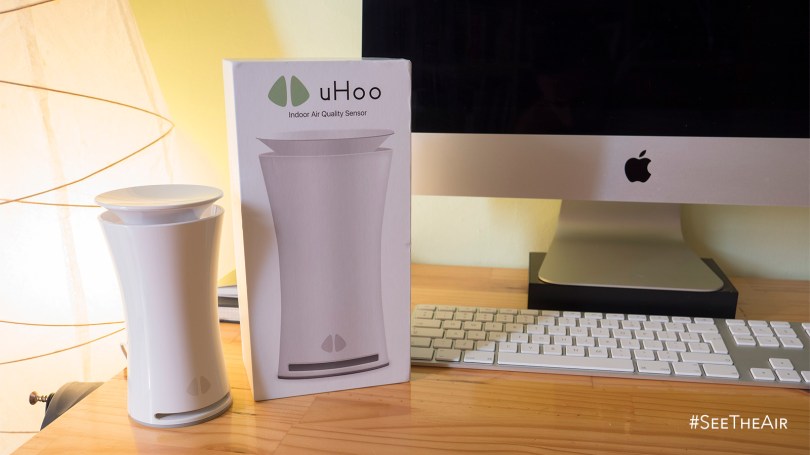
Finally is here. After having an adventure with the postal service for +40 days the uHoo device found its way to my home. I want to thank uHoo for its persistence.
Let me start by saying that this is a very promising device because it features 9 separate Sensors for Air Quality monitoring and there isn’t any other device with so many sensors for indoor use. The company was founded in August 2014 and it took them two and a half years to develop uHoo.