Thank you Visitors

Screen Shot 2016-03-09 at 23.16.46.png

I would like to thank you all, for visiting my blog in daily basis. I am very happy knowing that my blog raises the awareness about air quality and the issues we are facing nowadays.

USA, India, Denmark, UK, France, South Korea and Germany among others are the main daily visitors from.

More cool experiments and informations are about to come. As always stay tuned.

Month of CO2 experiment Results

The indoor CO2 experiment has ended and the results are quite interesting. Let’s recall what was the experiment about for those that don’t remember. During February I took CO2 measurements for 24 nights (12 nights without plants and 12 nights with plants) by recording the highest CO2 values during night time.

The main questions were:

  1. Is the atmosphere inside the house getting worse during night?
  2. Can specific plants help the air quality during night?

Answers:

  1. Yes, The atmosphere is getting x3 times worse, at least the CO2 levels are increasing x3 times each night. It’s winter and the house stays closed during all that time, so CO2 builds up during night.
  2. Yes, there are some plants such as the Snake Plant that can help us. In my experiment I used 2 Snake plants one small and one medium size. The CO2 didn’t decrease dramatically, but there was a significant difference.

There was a difference of ∼170ppm less CO2 when I placed the plants near the CO2 Sensor. In the measurements that I took, I decided to add some notes because during windy nights I noticed that CO2 levels were lower than during normal nights, I guess because of the air pressure and the lack of isolation in some windows.

Conclusion:

The right plants are helpful and if you think that we are growing up and we are developing during our night sleep then it worths the effort to re-evaluate the air quality during night.

CO2 levels experiment

CO2 Past Present Future

CO2 has increased the past years but do you know how much ppm of CO2 is there in our atmosphere now and how much ppm of CO2 was there in the past?

co2_data_mlo

One thing is for sure that it is climbing up and we are the blameworthy.

co2_trend_mlo

As you can guess the estimations for the CO2 in the future will be even higher and it is estimated that in 2100 it will reach a value of 800ppm (double than now).

December historical levels -averages

1958 – 314.67

1959 – 315.58

1960 – 316.19

1961 – 317.01

1962 – 317.69

1963 – 318.31

1964 – 318.71

1965 – 319.42

1966 – 321.08

1967 – 321.96

1968 – 322.84

1969 – 324.11

1970 – 325.13

1971 – 326.01

1972 – 327.55

1973 – 328.64

1974 – 329.5

1975 – 330.9

1976 – 331.65

1977 – 333.47

1978 – 334.83

1979 – 336.78

1980 – 338.29

1981 – 339.9

1982 – 340.88

1983 – 343.07

1984 – 344.55

1985 – 345.82

1986 – 347.15

1987 – 349.18

1988 – 351.44

1989 – 352.84

1990 – 354.27

1991 – 355.07

1992 – 355.53

1993 – 356.84

1994 – 358.87

1995 – 360.61

1996 – 362.18

1997 – 364.33

1998 – 367.08

1999 – 368.04

2000 – 369.67

2001 – 371.18

2002 – 373.71

2003 – 375.93

2004 – 377.45

2005 – 379.92

2006 – 381.79

2007 – 383.89

2008 – 385.56

2009 – 387.31

2010 – 389.73

2011 – 391.83

2012 – 394.28

2013 – 396.81

2014 – 398.85

2015 – 401.85

Table data source: Dr. Pieter Tans, NOAA/ESRL

When I was born in 1984 I was breathing 344ppm of CO2, now my body is breading 403ppm of CO2 (59ppm more). CO2 isn’t a direct threat for our health but it’s a direct threat for our planet and as a consequence an indirect threat to us.

Are we capable stopping the increase of CO2, What do you think?

Month of CO2 experiment

bedroomday0000 copy

So I am conducting a home experiment by observing the CO2 levels during night and my experiment focus on two fundamental questions.

  • Is the atmosphere inside the house getting worse during night?
  • Can specific plants help the air quality during night?

This experiment needs time, so you have to be patience till the experiment ends at the end of this month (February).

Stay tuned.

PM2.5 Device Comparison

There are so many devices available right now on the market that measure PM2.5 (as we can see on this post) but there aren’t all of them the same. In my opinion PM2.5 is the key for air quality monitoring. Different sensors, different manufacturers and also different software can give different results.

Let’s try to analyze them and see which of them are accurate and which ones aren’t. In order to do that firslty I will present some the sensor manufactures and models. Prices are in USD:

  • Novafitness SD011 ∼23$
  • Plantower PMS1003 ∼17$
  • Plantower PMS3003 ∼17$
  • Shinyei PPD42NS Made in Japan ∼10$ (R² ∼.83)
  • Shinyei PPD60PV (More expensive than the PPD42 because it allows smaller particle detection) Used by AirBeam
  • Samyoung DSM501 Korean copy of the Shinyei PPD42 ∼5$ Used by Speck
  • Sharp GP2Y10 ∼15$ (Used by Awair and probably by Foobot) (R² ∼.74)
  • TZOA RD02  135$-600$ Used by TZOA Wearable (R² .9253)
  • Dylos DC1100 ∼300$ (R² ∼.85)
  • DustTrak TSI DRX 8533 ∼3000$ (R² ∼.97)
  • Turnkey Instruments Dustmate ∼3200$

Here we can see some graphs of different sensors cheap ones and expensive ones. In general the expensive ones are more accuarte and industrial graded but some new companies have managed to build low cost sensors with high accuracy.


Screen Shot 2016-01-29 at 22.49.01
aqicn.org/sensor
Screen Shot 2016-01-30 at 19.12.23.png
Shinyei R-squared .83 correlation value
Screen Shot 2016-01-30 at 19.12.59
Sharp R-squared .74 correlation value
gm4z989eevgqiw7g3uy7
TZOA R-squared .9253 correlation value


On the table below there are some of the devices that measure PM2.5 among other stuff and have been reviewed by the Air Quality Sensor Performace Evaluation Center aka AQ-SPEC www.aqmd.gov. Focus on the R² (correlation) values on the last column “Sensors vs FRM/FEM Method”.

An R2 of 1 indicates that the regression line perfectly fits the data, while an R2 of 0 indicates that the line does not fit the data at all. So, closer to 1 then better results.

summarytable


References:

http://aqicn.org/sensor

http://www.aqmd.gov/aq-spec/evaluations#&MainContent_C001_Col00=2

http://www.davidholstius.com

http://www.howmuchsnow.com/arduino/airquality/

Low cost air pollution sensors: New perspectives for the measurement of individual exposure? Madelin Malika, Duché Sarah

https://www.indiegogo.com/projects/tzoa-wearable-air-quality-tracker#/

Air Quality Devices – Comparison 2016 Q1

New Year and new devices on the market. Here is the new complete list.

  • Prices may vary during time.
  • Some Companies don’t specify on their data sheet if their devices are capable to measure PM2.5 or PM10 and they just mention the word dust.
  • Some other companies say: Our product goes beyond CO₂ by analyzing substances that directly affect your well-being by measuring VOCs. They aren’t clear if their devices have CO₂ sensor.
  • The classification of the design between BadGood and Very Good is based on the materials (plastic, wood, glass and metal) that they have used and the aesthetic on my personal opinion.

Monitoring my house during vacations

awairmonitor

So, I left my home 20 days ago for vacations but I left Awair (one of my Home AQI devices) ON just because I wanted to monitor the house during all that time of absence.

Every day all the values of VOCs, CO2, Temperature and Humidity were stable and normal when suddenly on 5th of January I noticed that the value of the VOCs index climbed from 1 to 2 (Awair dispays VOCs on an index values not into parts per billion). Why did that happen? Well my first thought was that someone has entered the house without my knowledge and indeed my sister in law had entered the house secretly during night to leave some presents (btw high in VOCs) for my nieces because she wanted to hide them before the The Three Wise Men day (a traditional day when Spanish people exchange gifts).

Bottom line my Home AQI device can function more than a simple air quality monitor and gives me a glimpse inside my house even when I am not present. I guess if my house had a flood problem, I could see a spike in the humidity and if a fire started, I could see a spike in CO2.

The Air in Italy (Rome)

On my previous post I have talked a bit about the air problems that Greece is facing now. On this post I will talk about my experience in Italy and more specific in Rome.

Great city with great history as well. They call it the eternal city but I will call it the noise city because they are part of the mediterranean temperament. I only had the chance to visit the city and not around but I have noticed that the air quality in Rome isn’t good at all.

Cigarettebutt

Smoking: From one hand people respect and they don’t smoke inside (Strong Law) but from the other hand by the time they exit a building they will smoke and smoke non stop. Cigarette Butt everywhere on the street. I couldn’t walk outside without having someone in front of me smoking.

minicar2

Cars: Vehicles are a big problem there as well. In Rome they even have many mini cars (one-two seats per car) I guess because of a parking issue that they may facing.

metro

Metro: The air quality inside Rome’s metro was horrible, unhealthy and unbreathable. I guess the ventilation doesn’t work and if it works maybe it’s time to renovate it immediately. In my opinion the metro didn’t have a good aspect at all. The price of the underground was €1.5 per journey or €7 for 24h or €24 for 7 days which I don’t find very attractive for a family and someone that goes to work every day. In Madrid for example the price of Metro is  €1.5 for a single trip but €11.20 for 10 trips which is more good if you work 5 days per week and you need two tickets per day during a labor week.

People have to realise that we need to make changes if we want a healthy future in Rome, in Athens, in London etc.

The Air in Greece

Winter holidays are here and after a long time I am back in Greece to spend them with my family. Unfortunately the crisis has affected the air quality here too.

IMG_2314
Fireplace
Fireplaces: Huge problem because most houses choose them as a heating source, so they burn wood nowadays. Previously they were burning oil but its price climbed up and people tured to wood. PMs inside houses are on high values 20-40μg/m3. The threshold is below 25μg/m3. Outside values are high too with similar values of 18-38μg/m3.

IMG_2320
Cigarette
Smoking: One more time Greek people disappointed me with the way they decide to behave in interior places. They smoke everywhere like in cafes, in restaurants etc. There is a law that prohibits that but they don’t follow it at all. How can we make people understand that this is a toxic air? It isn’t about them only but for all the people around them that they choose not to smoke like non smokers and kids. They are so proud smoking inside. Socialy is still something cool in Greece I guess. I asked some friends what will happen if I raise my voice. Will I find justice or will they throw me outside the places? Sadly the answer was that probably they will think I am crazy.

IMG_2317
Car’s Exhaust Pipe
Cars: Yes there was a big scandal about some automobile companies that made-make car that pollute air beyond any consideration but that hasn’t affect how people think and move. People love Cars and traffic apperantly too.

IMG_1976
Agricultural Fires
Agricultural Fires: Through my trip from Sterea Ellada to Peloponeso farmers all over the countryside were burning unwanted material, from plastic to wood. I was hopping to breathe some pure air but that wasn’t the case on that trip. I know that there is a law that prohibits that action but I guess people don’t care.

If you are aware about air quality, a wearable device like TZOA is absolutely necessary in case you want to find places with good air quality in Greece or on the rest of the planet Earth.

Foobot vs Awair (updated)

awair vs foobot

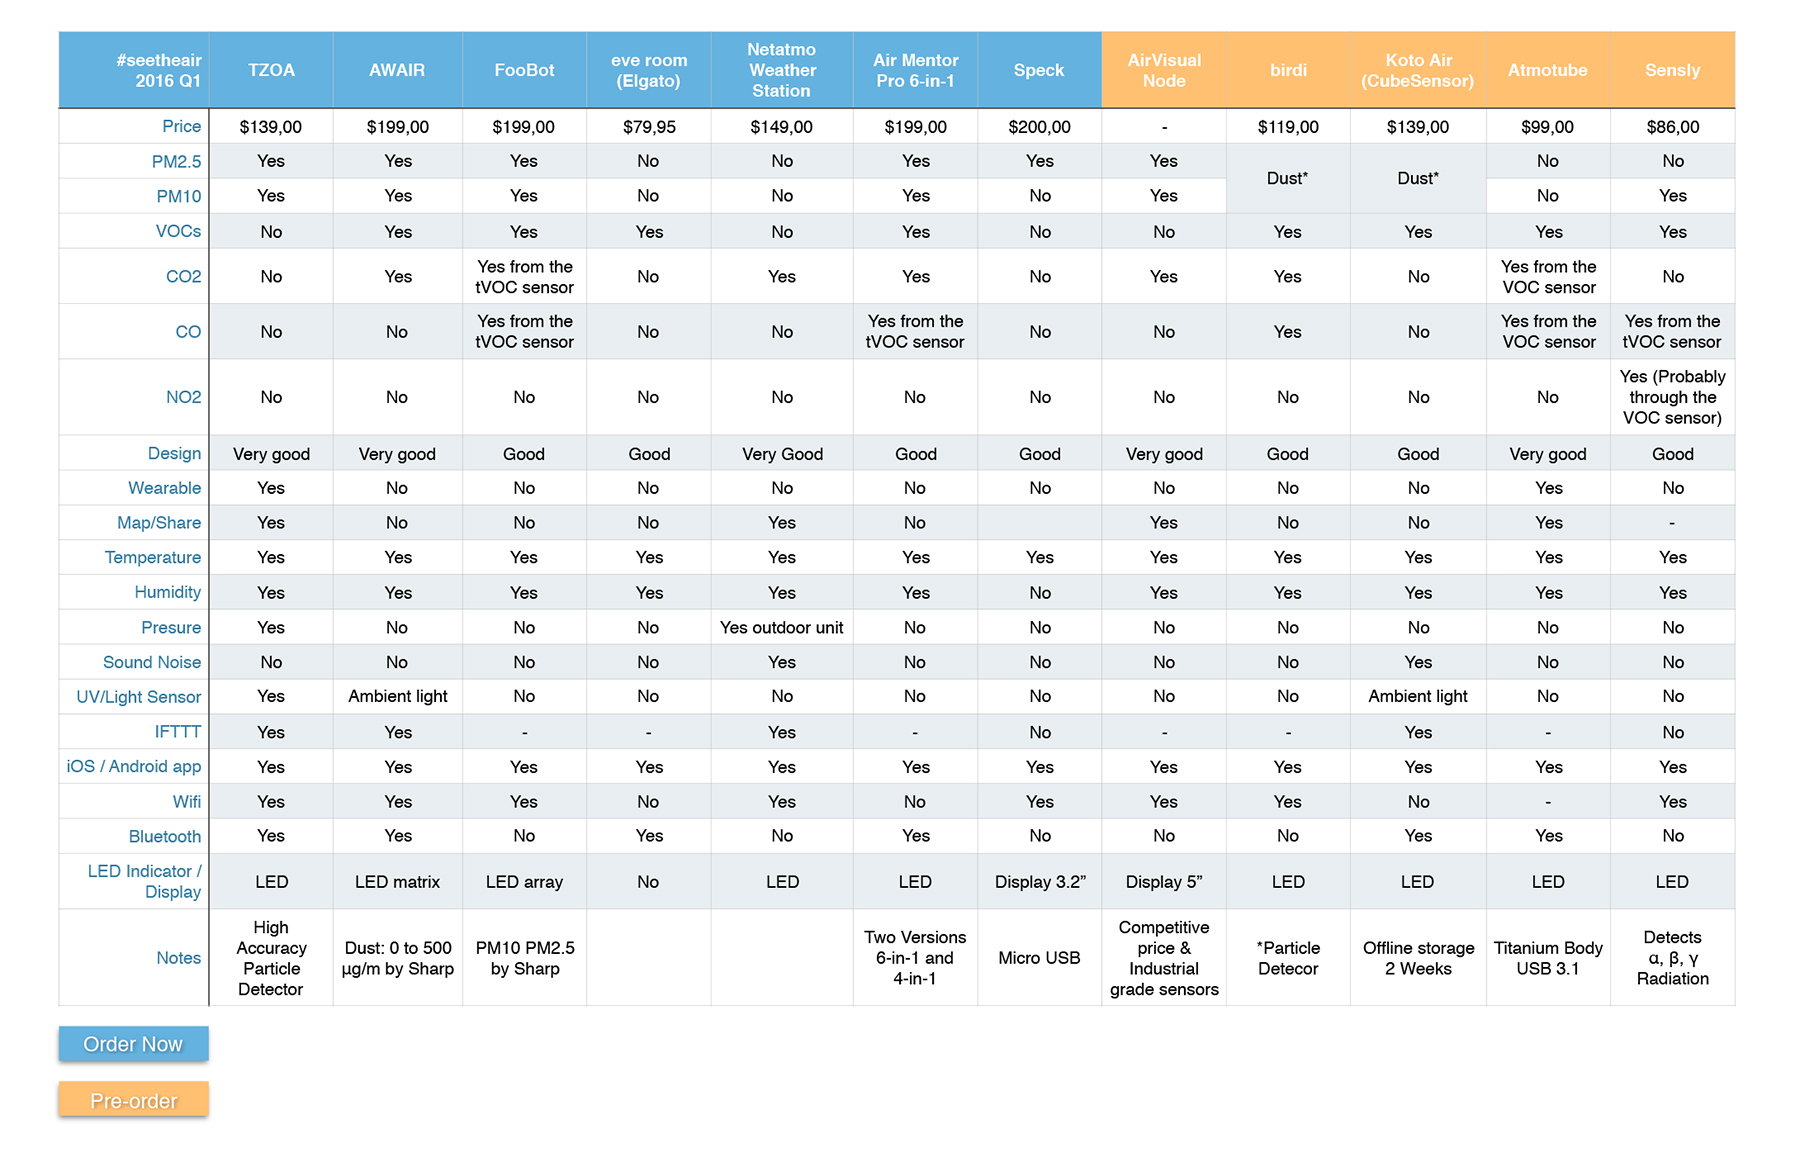
Both devices are equipped with the basic home-environment sensors.

  • Temperature sensor
  • Humidity sensor
  • VOCs sensor
  • CO2 sensor
  • Particular Matter sensor.

Carbon Dioxide:

Foobot features all the above sensors except the CO2 sensor, it calcualtes the CO2 through an algorithm and the VOCs sensor which doesn’t make it very accurate. Awair has a dedicated sensor for the CO2 which makes it a winner in this category. Both devices display the CO2 in parts per million (ppm) values.

Volatile Compounds:

Foobot can measure and display the VOCs in parts per billion (ppb) values which make it perfect if you want to have precision into your measurements. Awair from the other hand can display the VOCs in Index values from 0 best to 5 worst. Foobot wins here (Awair could fix that with a simple app upgrade).

Particular Matter:

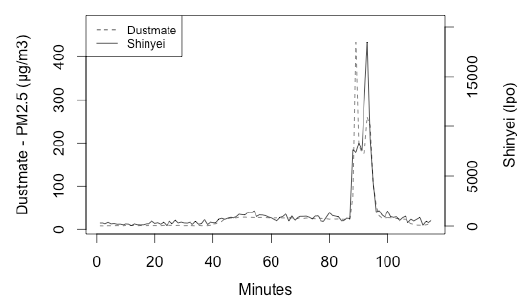
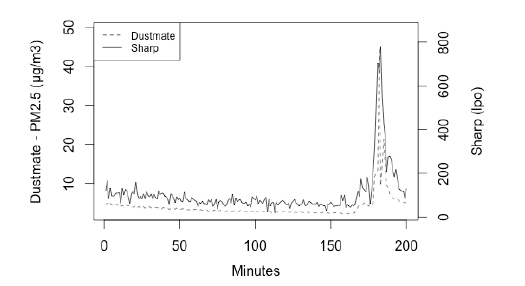
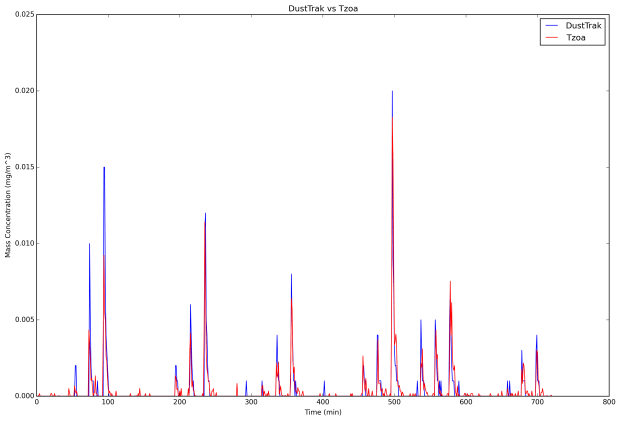
Foobot measures PM10 and PM2.5 and Awair measures PM10 PM2.5 too. Both measure them in μg/m³. They use  exactly the same Sharp dust sensor, but the readings I get are different!

Temperature/ Humidity:

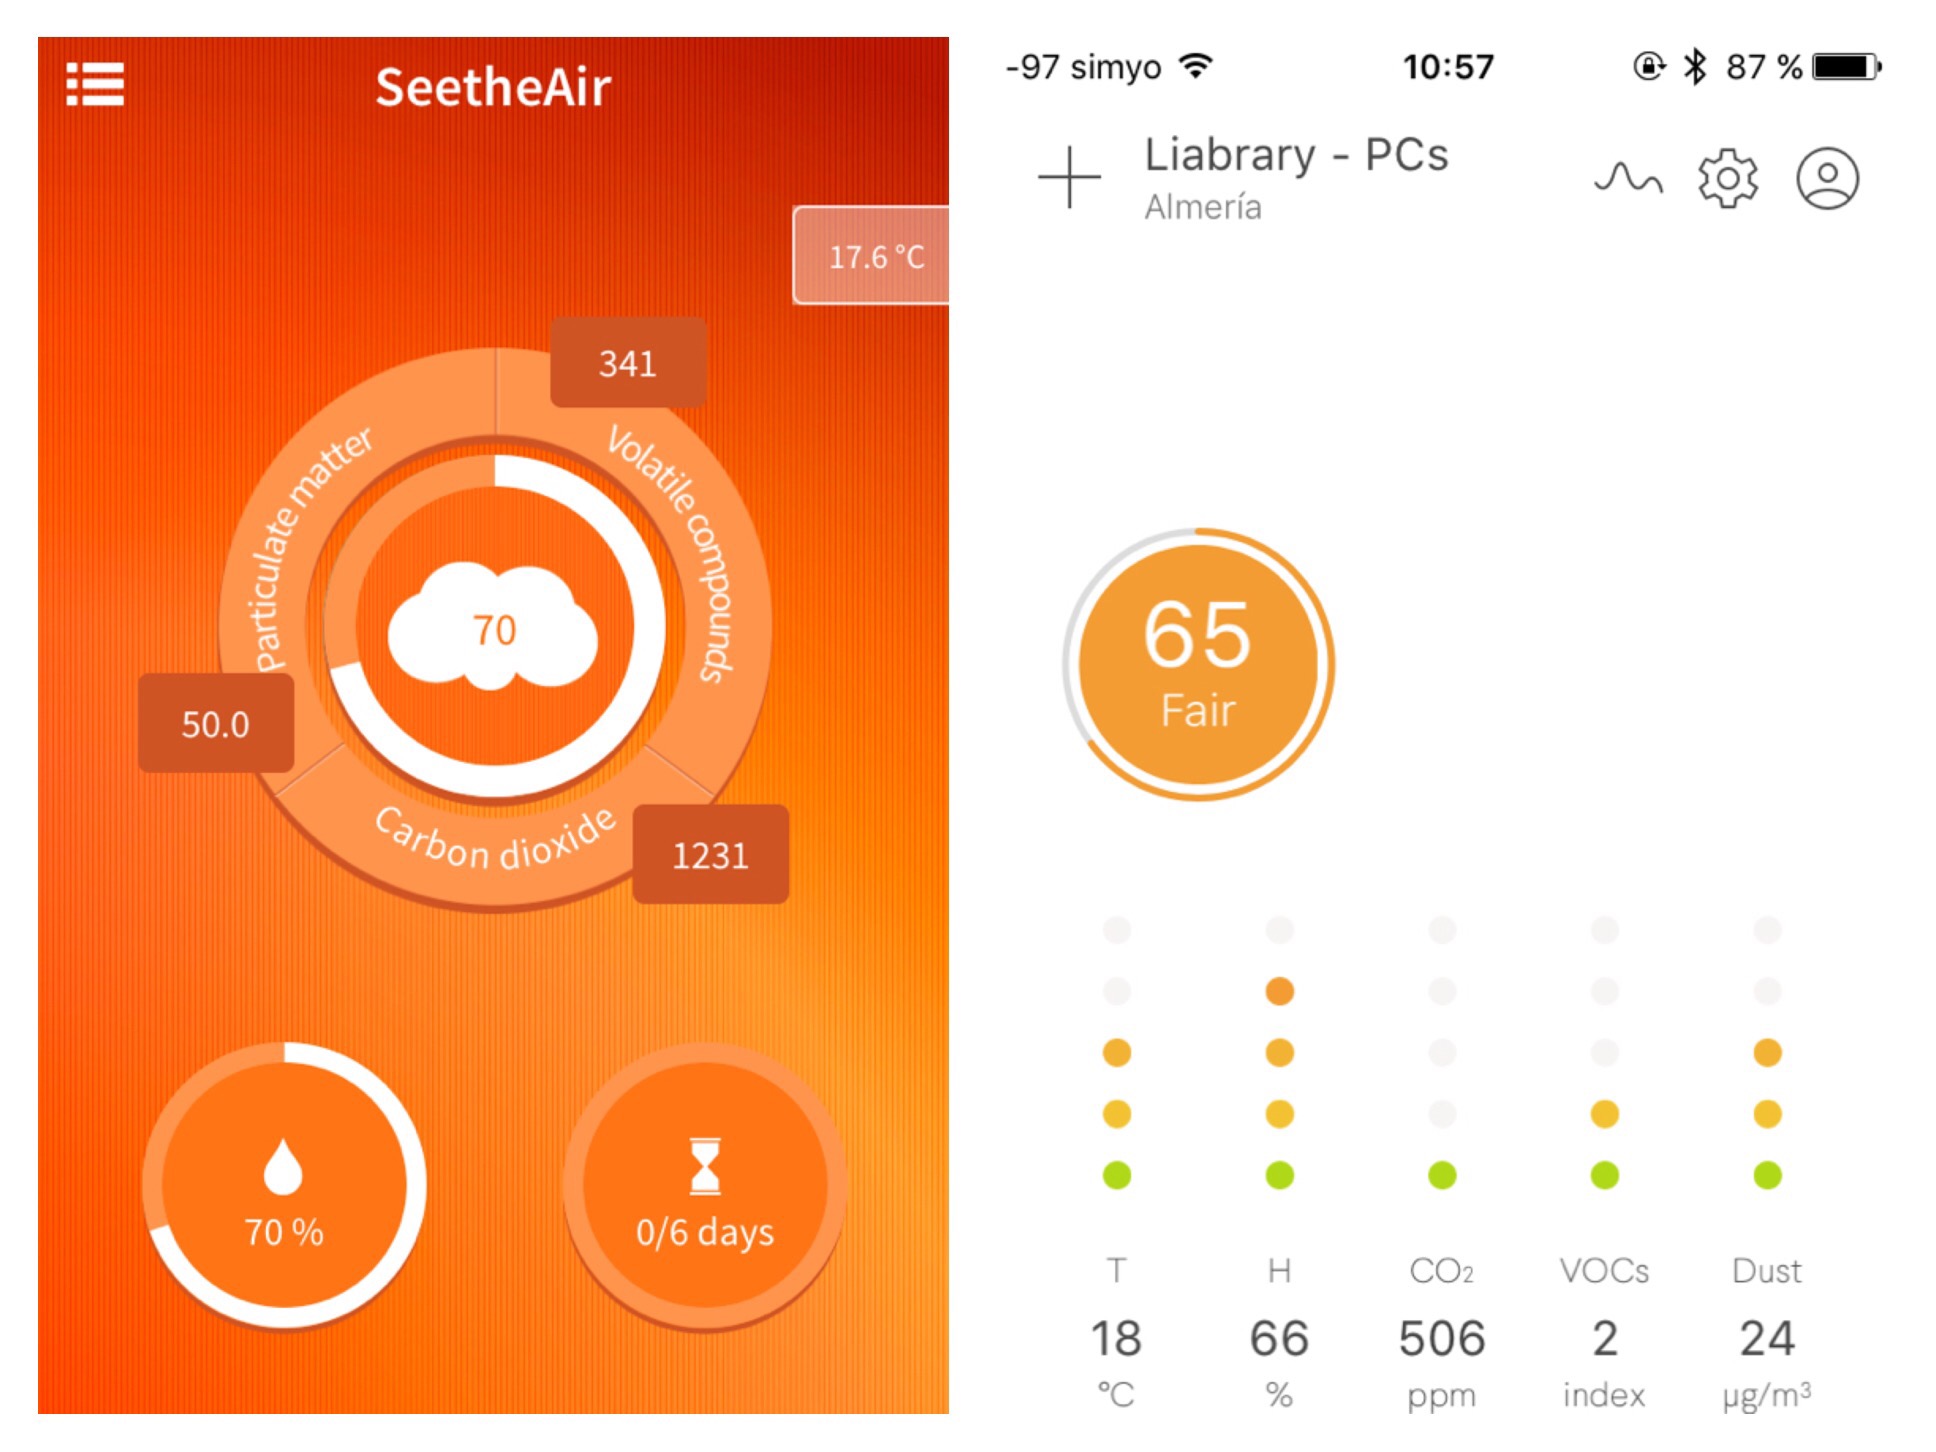
I had the devices side by side for a week and they always had different indications for temp, humidity and CO2. As you can see on the pictures below.


 Both companies claim that they have tested the devices into a chamber.

Connectivity:

Foobot so far works fine via WiFi network WPA2. Awair has had some trouble staying connected, it looses the connection time to time. Awair features Bluetooth but it is only useful during initial connection with your phone (they told me that they are working to fix the wifi issue).

UI/UX:

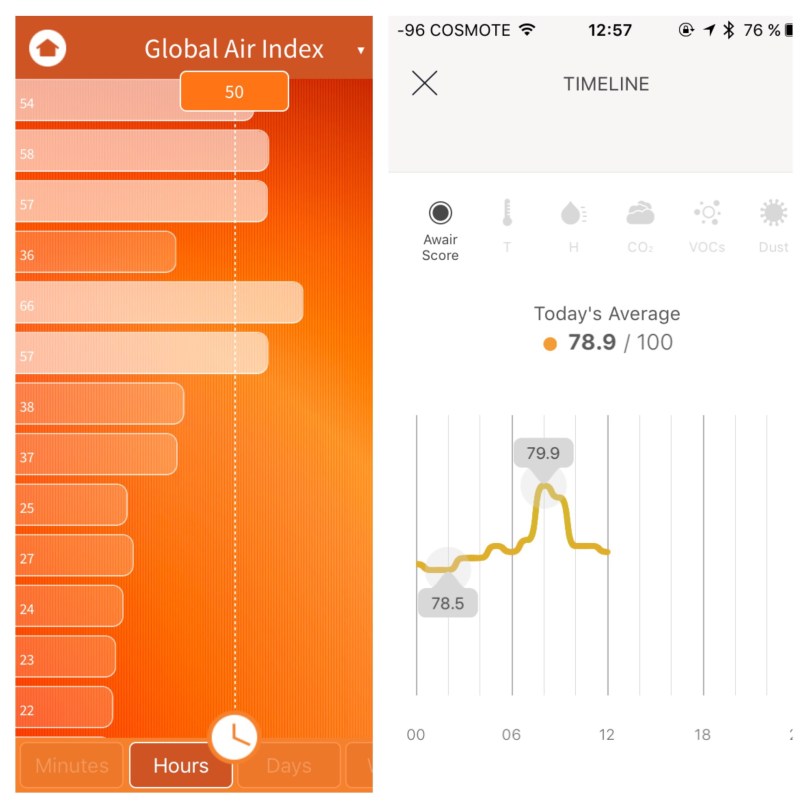
Both devices have a unique interface. Foobot history browser is far more advanced and it can remember measurements for a long time although they need to design it a little more intuitive. Awair can’t display the history far from 24h but the main screen is friendlier and easier for the simple user to understand.

Conclusion:

Some of the features can be enchaned during time because they are software based. As a result, for the moment the scores are:

  • Awair 5/6
  • Foobot 5/6