
It will please some of you to know that I am going to compare Atmotube Pro with other Particulate Matter sensors and monitors. First with an outdoor monitor and in this case the Luftdaten DIY and second the AirVisual which is more of an indoor monitor.
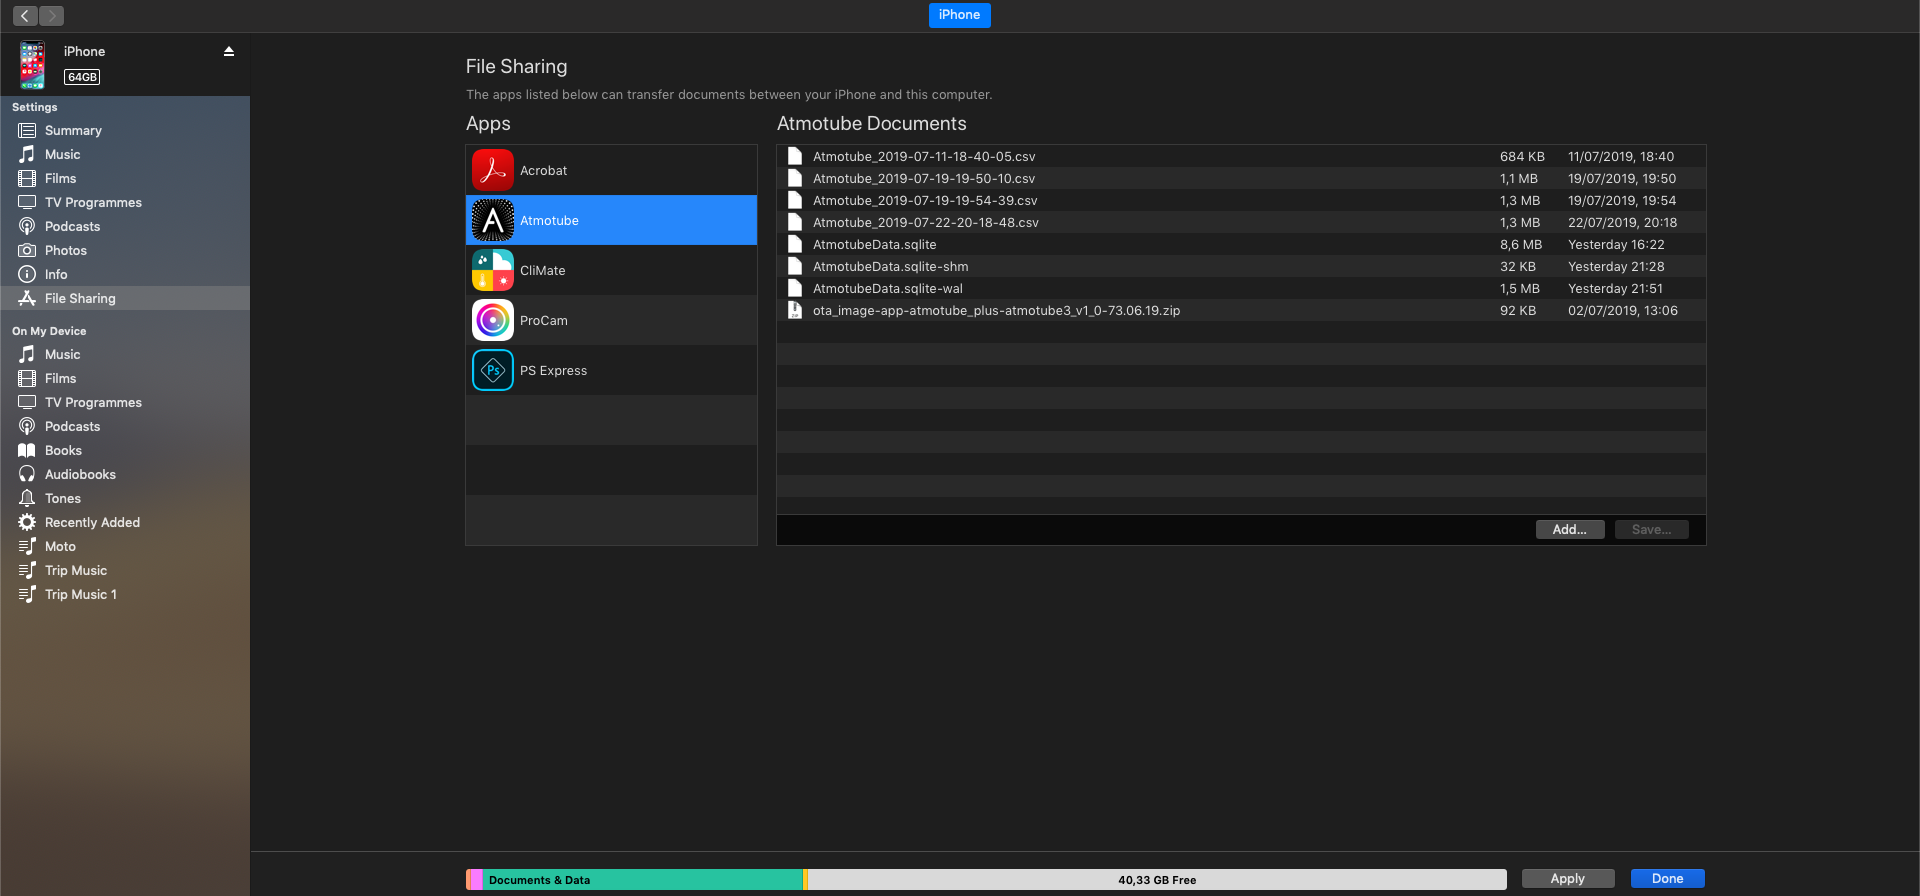
Before I begin with the comparisons I want to dive a bit deeper and tell you that apart from exporting the .csv from the app directly, you can also access Atmotube’s .csv files (in case you have an iPhone) from the File Sharing service iTunes provides when you connect your phone with your computer (macOS & Win). This way you have more control over which days you upload to your computer.
The device accumulates all measurements non-stop from day 1. If you want to reset the measurements, you have to Clear the database: Settings –> Your data –> Clear Database. For example, after +700 days you will keep exporting the .csv file with all the measurements from day 1. If that’s what you want then just keep the database on your app, don’t clear it.
Many of you have asked me which Particulate Matter sensor it uses. I am happy to tell you that it uses the new Sensirion SPS30.


Luftdaten vs Atmotube Pro

First, Luftdaten DIY AQ monitor vs Atmotube Pro in outdoor conditions.
As you can see from the graphs below the correlation between these two devices is astonishingly similar. They share the same trajectory and the same spikes in PM2.5 concentrations. I had to adjust a bit the time between the two graphs because Atmotube was set to take measurements every 5 minutes and the Luftadent every 3 minutes. Atmotube measured an average concentration of 8.34 μg/m³ for a day of constant measurements and the Luftdaten an average concentration of 8.63 μg/m³. There is a great correlation of coefficient r2∼0.90.

AirVisual vs Atmotube Pro

Second, AirVisual AQ monitor vs Atmotube Pro in indoor conditions.
Both devices were side by side for 2 whole days. Again they share the same trajectory and the graphs are quite similar but not as similar as the Luftdaten. For example, there were some pollution spikes that AirVisual didn’t register. Sometimes this is normal due to the time difference each device takes measurements. This time the correlation of coefficient is lower.

Conclusion
If you trust the Lufdaten DIY project which has more than 9000 active devices and it is growing then Atmotube PRO won’t disappoint you. The particulate matter sensor is good enough to inform you when the air quality deteriorates. Remember, this is a small device and everything inside is packed very close together which means sometimes depending on the environmental conditions the temperature and humidity readings may get affected. Although the SPS30 sensor is new in the market, it is quite promising.
Discover more from See The Air
Subscribe to get the latest posts sent to your email.

[…] I visited 10 countries and I evaluated the air quality with a portable air quality monitor (Atmotube PRO) but as well as the behavior of the people in these countries as they tend to have different […]
LikeLike
[…] to high levels of PM2.5 has been shown to shorten life expectancy. Some monitors to consider are; Atmotube Pro, Awair Element, AirVisual, and […]
LikeLike