Review: Airthings Solutions

Airthings is a pioneer company as they have developed an in-house sensor for Radon detection but their expertise doesn’t stop there. They have expanded their product-line with domestic and business solutions with one thing in mind, how to enhance indoor life.

Since the beginning of the pandemic, I have received countless messages from people all over the world who have found themselves stuck inside for a long time and asking me to help them improve their indoor environment. Domestic users but also businesses that want to go a step further and offer a more productive environment for their employees after the lockdown.

I have already reviewed the Airthings Wave Plus and today I would like to review how each product offers a solution inside the house.

Airthings teen room

The Wave Plus is equipped with a Temperature/Humidity, VOC, Radon, and more importantly a CO2 sensor which is the first sensors to have in mind when you think teenagers. Teens tend to spend a lot of time inside their room, listening to music, studying, doing homework, watching countless videos on TikTok and Youtube, and messaging with other teens at the same time via Instagram. Teens don’t worry about air quality but I bet you all have experienced the musty smell every time you open their room door. Part of the smell is a crazy high CO2 concentration combined with VOCs.Read More »

Review: Node-S by Clarity

I love clean air and even when we are indoors the air we breathe comes from the outdoor environment, like streets, small neighborhoods, city superblocks, etc. There are high probabilities that you, the reader, live in a city and the air you breathe isn’t clean enough to support your healthy lifestyle.

Most cities in Europe, as far as I know, have two state reference stations (a background and an urban) for air quality monitoring. They are great, with highly accurate and expensive equipments inside. Unfortunately, most of the time they are old and outdated which limit their ability to engage people to look into the air quality problems we are facing.

My city hosts around 200,000 people and the one urban reference stations we have isn’t capable of measuring PM2.5, at least not as most people will expect. It registers ONE daily average PM2.5 measurement (and not always). Data are free but in order to get these daily measurements you need to file a form and wait a month as manually a lab examines the filters were PM2.5 particles are captured.

Of course this is a tedious way to report data in 2020 at least in my opinion, I understand the “accuracy” obsession that surrounds some scientists, they can keep doing that but also they need to report real-time data to citizens if they want them to change the way they think and behave. I mean, what can I do if I learn that the air was dirty a month ago?

Here comes a outdoor monitor like Clarity Node-S. In my opinion, cities have no excuse not to install such monitors around the city and allow citizens to see the air they breathe. Literally, it is so easy to pick a place in a city and install a monitor. Clarity takes advantage of the low-cost sensors and has developed a solution hard to resist.

Read More »

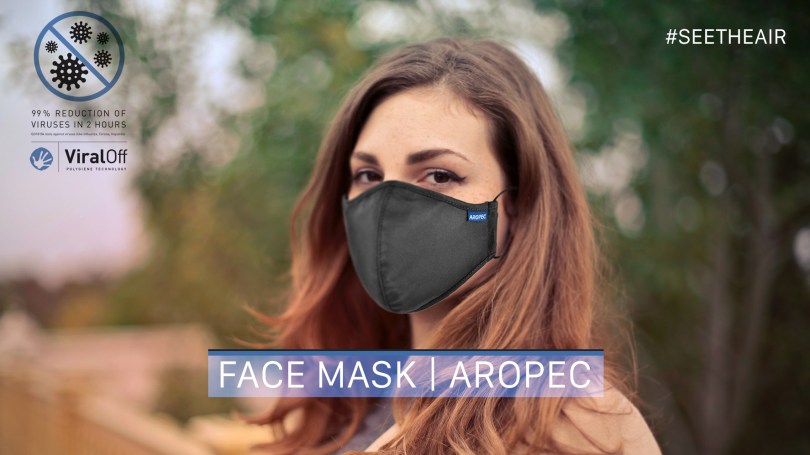
Review: Aropec – Face Mask (COVID-19 & PM2.5)

A lot of people are still reaching me and asking me to advise them on which masks should they purchase as they want to protect from the COVID-19 disease without breaking the bank, as some of the masks out there are quite expensive.

Aropec is a great solution for individuals and companies that invest in their employees protection. The mask offers 3 key features; It is water repellent, washable (very important for me), and antibacterial thanks to Swedish Polygiene © an anti-virus and odour technology.

The mask offers 3 layers of protection.

  • 1st Outer Layer: Water repellent fabric with Polygiene “ViralOff” treatment. This is certified to kill 99% of viruses (like hepatitus, Influenza, Corona) and other bacteria. It has been tested against Influenza A, BirdFlu, Norovirus and Corona (SARS) over the years, and in all cases, have achieved 99% levels of reduction. It is certified to the ISO18184:2019 standard, which makes it legit and it is not just a claim.
  • 2nd Middle Layer: Non-woven fabric with dust and particles filtration. Non-woven fabric is used generally in masks and is proving to be effective at capturing respiratory droplets and filtering PM2.5 particles.
  • 3rd Inner Layer: Soft, moisture-absorbing and breathable fabric treated with Silver Ion Polygiene. Again, the Polygiene treatment captures and breaks down unpleasant odours, and is certified antibacterial, meaning it can protect the user from bacteria and transmission of droplets.

Mask-Aropec

My experience

Read More »

Air Quality data that make sense for the average users

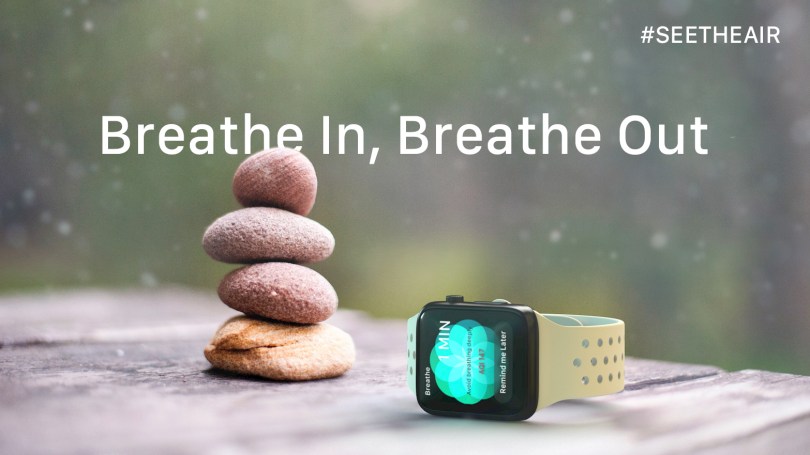
Have you ever used an app that will help you relax? Well I have, one of them is Apple’s Breathe app that can be found in the Apple Watch since WatchOS 3. The idea behind the app is that a steady breathing technique will help you relax and hopefully reduce heart rate pulses. Great app but I think Apple or any other developer should combine Air Quality (AQ) data with their breathing/meditation app.

In a mockup that I designed based on Apple’s Breathe app (I chose Apple’s Breathe app for its simplicity and effectiveness), I placed the Air Quality Index (AQI) information inside the app and depending on the AQ at that period the user will be prompted to avoid breathing deeply when the AQ is unhealthy or to adjust the duration when the AQ is good and start. In case the AQ is unhealthy a reminder will notify the user to come back for a breathing session later when the air is healthy enough for deep breaths.Read More »

Low-Cost Portable Monitors vs Reference Monitors Part2

A long time has passed since I wrote Part 1, and I presented the results for NO2 and PM2.5 measurements between the low-cost sensors and the reference monitors. Due to the COVID-19 pandemic, laboratories were closed for 2 months so they couldn’t send me the results but since the 1st of June, I have the results in my hands.

Dates  PM 2.5 Mediterráneo
31/01/2020 15,83 µg/m3
03/02/2020 17,35 µg/m3

These are the data they sent me. Two daily average values for the 31st of January and the 3rd of February. Data for the 1st and 2nd of February weren’t available for a validity reason.

I know it is ridiculous for an urban state reference station to give you just two values for four days. I am curious to learn what exactly they do with these values, what kind of studies (rolling my eyes now).

Unfortunately, I am unable to compare the PM2.5 low-cost sensors with the BAM results as I wanted, so the only thing I could do is to average the values from the low-cost sensors for the specific days and place them side by side. However, it won’t do it as it will create a huge confusion.

Conclusion

You start evaluating portable low-cost sensors, and you end up finding that the official city station is so outdated (accurate but outdated). This is the reason I am going to review an outdoor monitor (Clarity) that is designed specifically for cities that lack real-time PM2.5 monitoring, and it can offer a denser spatial coverage.

Regarding the Atmotube Pro and Flow 2, I will also compare them against the outdoor monitor in order to get a better idea about the PM2.5 monitoring capabilities.

Is covid-19 going to halt the air quality industry?

No, this is not the case for the air quality industry, but quite the opposite.

Since the outbreak of the pandemic, the media has covered the topic quite extensively. Big newspapers like The Guardian, The Sun, NY Times, etc have written at least a few articles about how good is the air outside and small local newspapers, which had never mentioned any environmental issue before, wrote about the same subject.

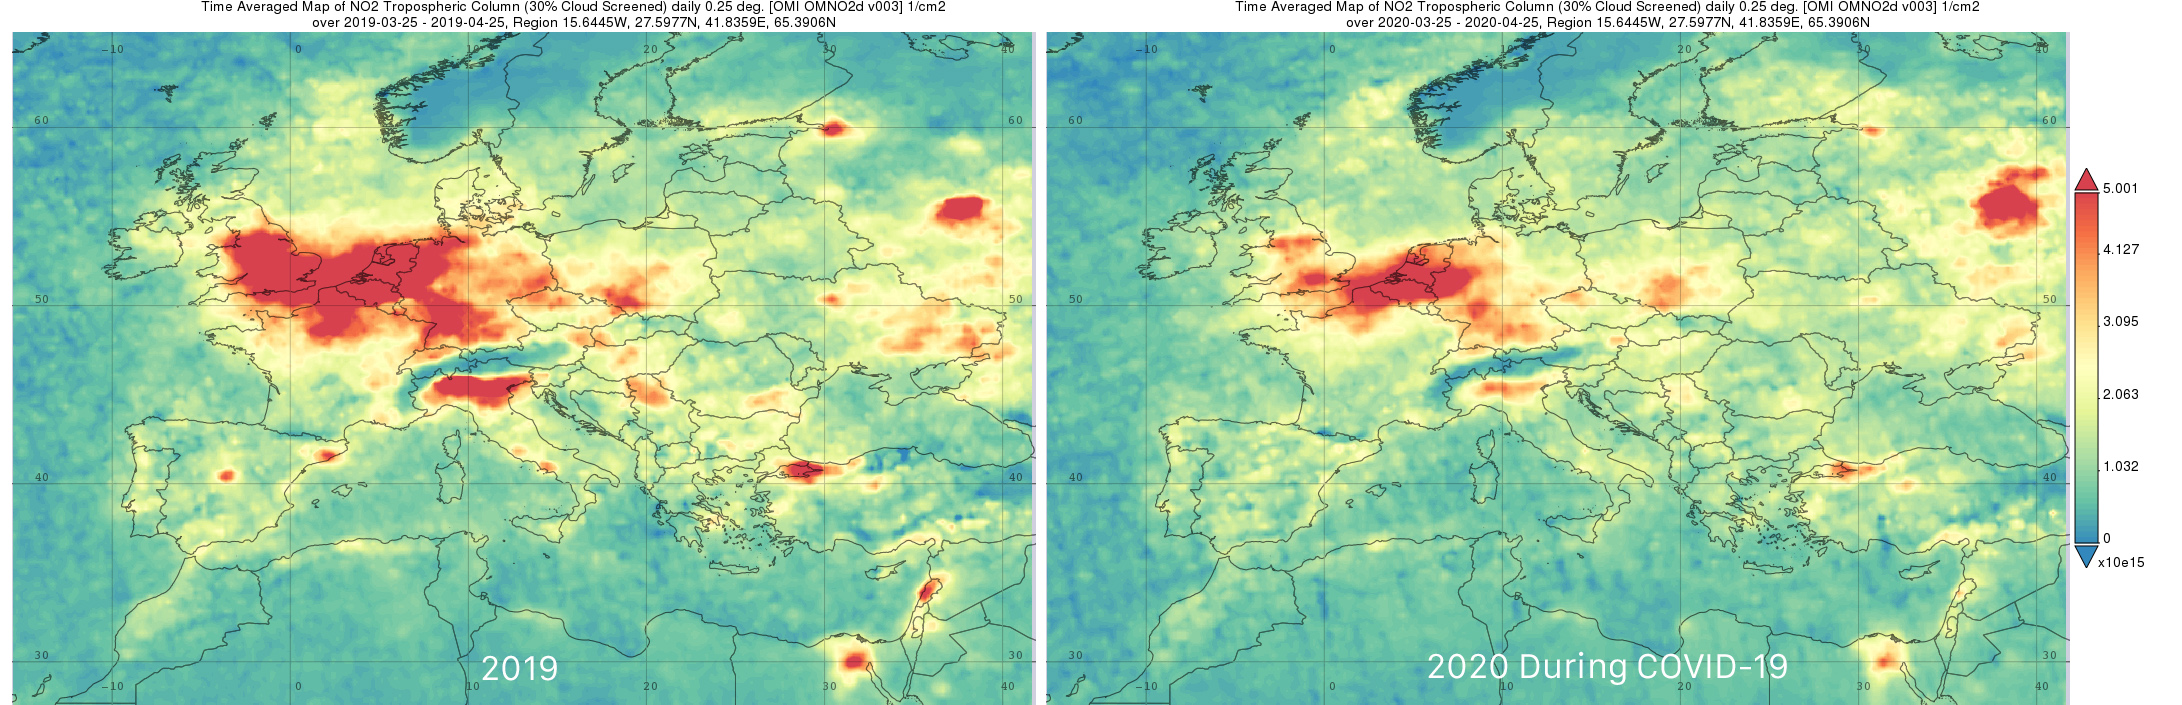
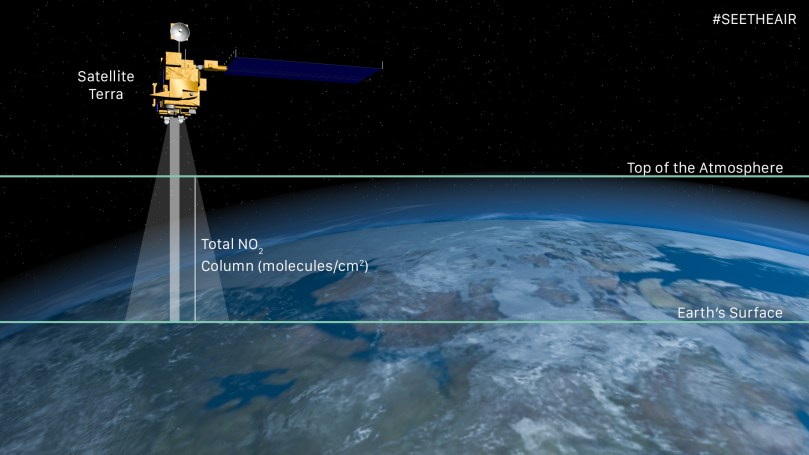
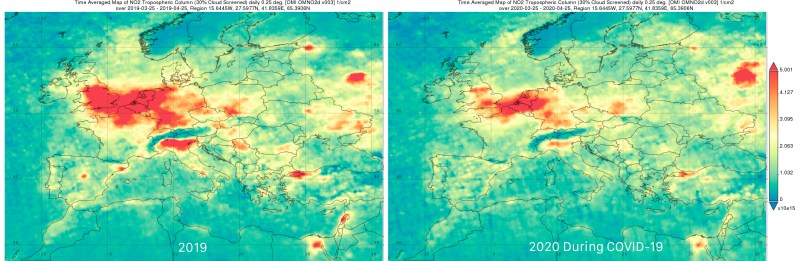
The pandemic has shocked people to their core, as a result, during the lockdown, more people became aware of the issue of air pollution and how traffic contributes a lot to the problem. In a recent NASA seminar, I learned that the satellite maps that we all have seen in newspapers presenting the NO2 concentrations before and during the lockdown, don’t represent the NO2 on the surface, where people breathe. However, they represent the total amount of NO2 from the surface to the top of the troposphere.
SatelliteGIOVANNI-NO2 COVID19

Indoors

Of course air pollution is not only present in the streets but inside our houses too, as a result, people have taken closer attention to indoor air quality as they spend 24/7 inside their houses, working, cooking, eating, relaxing, and playing with their kids.

Being all day long inside your house makes you think about how you can improve the indoor conditions and of course, air quality is as important as a pillow for your head during a night’s sleep. You want to be in a comfortable environment with the right temperature, humidity, and air quality.

This is the reason many companies sold out indoor air quality monitors. I had people asking me where they could find an air quality monitor and some companies telling me “we are out of stock” or they were running to fulfill orders.

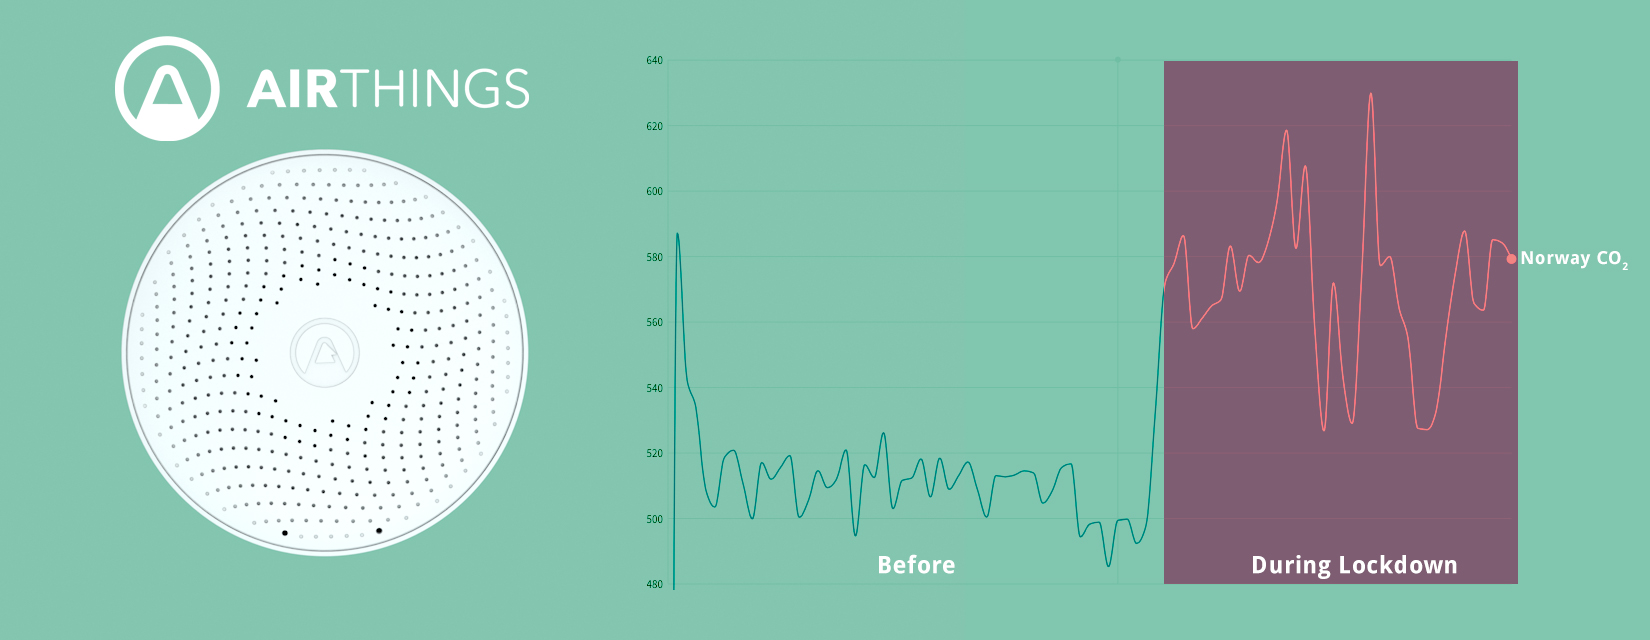
Let’s see what AQ data from Airthings say before and during the lockdown. Immediately, we can understand that there was an average increase in CO2 concentration inside houses. Nevertheless, there are some factor we have to consider:

CO2 indoors US Norway

First of all, Airthings’ users are conscious about the air they breathe because the devices help them see the air quality so they may take measurements against high CO2 concentrations. Imagine what happens to houses were no monitors can be found. Secondly, we have to consider that houses in northern Europe tend to have HRV systems and fresh air is introduced automatically to the indoor environment.

All in all, not all houses, have mechanical ventilation systems and during winter, when windows are closed, CO2 levels tend to be above 1000ppm for a great period during the day. Before COVID-19, houses used to “breathe” when homeowners went to work or school but not anymore, so monitoring the air quality indoors is more crucial than ever before. Especially if we want to avoid Brain fog, which is the inability to have a sharp memory due to high CO2 concentrations.

Outdoors

On the other hand, outdoor air was and still is important because one day we will return to a “new normal life” where we will need to breathe clean air outdoors. Cities are preparing the streets for the post-pandemic era, we have seen examples of cities allocating more space to the pedestrians and cyclists but also there are cities that now are investing in IoT low-cost outdoor air quality stations that can easily be placed all over the cities and provide us with a more dense spatial air quality coverage.

The improved and dense spatial air quality coverage will allow the policymakers to make better decisions and will allow citizens to have access to air quality data more easily than before as the outdated air quality stations we can currently find in many cities sometimes require manual work to register values one by one and they are not data-driven. This manual work makes data not real-time, hard to reach, and unsuitable for instant decisions. For example, in Andalucia, Spain the PM2.5 measurements are available after a month from the day the data were taken, and then you need to file an official form in order to access them.

Liberating accurate information and allowing people to access it, I think will transform the way we think and act, two important words that are key in order to address the issue.

Indoors outdoors air quality

Dear Air Purifier Manufacturers

An Introduction

Air purifiers are machines that help us breathe cleaner air when for some reason the air quality indoors is bad. There are a lot of companies and models out there for costumers to choose and most of them offer some kind of High-efficiency particulate air filtration aka (HEPA).

HEPA filters are made by compressing randomly together thin fibers of glass or synthetic material like PP+PET with diameters between 0.5 and 2.0 microns. The air space between HEPA filter fibers is typically much greater than 0.3 μm.

HEPA Fiber2_0094
Clean HEPA fibres

Read More »

Nanoparticles in the air we breathe

What are nanoparticles?

Let’s dive into nanoparticles or as the atmospheric scientists call them ultrafine particles (UFP) or PM0.1. The term nanoparticles applies to material engineering, eventually, both terms are the same thing. A nanoparticle is a microscopic particle with at least one dimension less than 100nm. One nanometer (1nm) is only three to five atoms wide.

Recent research suggests these nanoparticles could be responsible for illness and death beyond our current understanding. We know that PM2.5 is quite small and can penetrate deep inside our bodies and it can reach even the alveolar sacs where the exchange of oxygen and carbon dioxide occurs.
PM2.5 is around 2,500 nanometers (nm) in diameter. However, nanoparticles are 100nm (0.1μm) or less. In comparison, they are 25 times smaller, as a result, they can reach any organ in our bodies.

Read More »

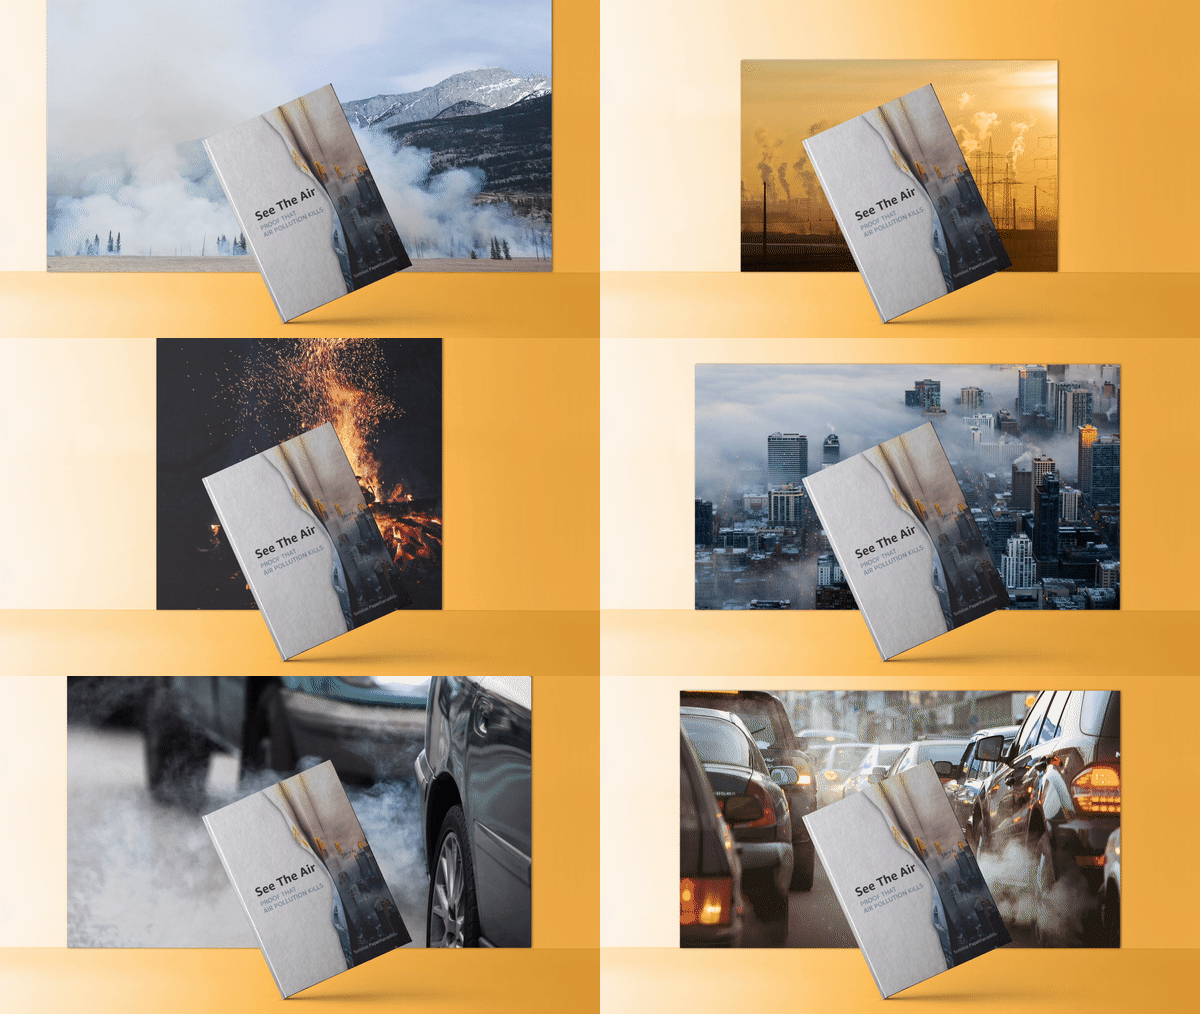
See The Air – Proof that air pollution kills

Since my first book “See The Air | The Essential Guide for Optimal Air Quality in Your Life“ was published back in 2017 many have read it, and many have followed my example and tried to write and describe the problem too.

There is some interest in the field, and I want to contribute even more by gathering all the available information regarding air pollution and its impact on health in this book. My intention here is clear, I want to shock people and authorities and make it clear that there is proof. Air pollution kills millions of people every year, and there is no excuse not to listen to brilliant scientists and the noble work they have done.

The book is available in digital and paperback form.

or

Local Haze v1.4 + uRAD Monitors

I have already mentioned this app on a previous post but I was waiting for this update anxiously as it brings more sensors to the app. Local Haze is an app for iOS devices that helps consumers easily view and understand air quality data, in particular, Particulate Matter with aerodynamic diameters less than or equal to 2.5 microns (μm) also known as PM2.5.

What’s new?

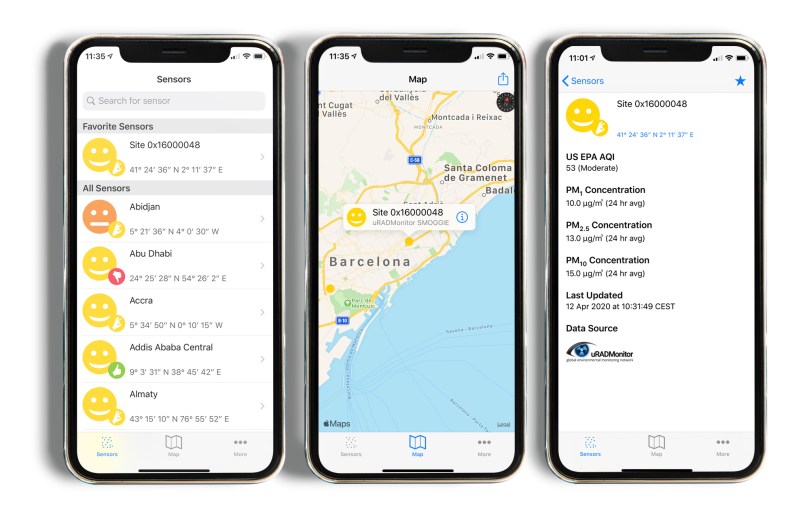
Amazingly, the team behind Local Haze was able to connect to the uRAD Monitors API, as a result users and communities will be able to see PM2.5 data right from their phone or tablet with just a tap. Additionally, the users can now view PM1.0 and PM10 values when the sensors support these measurements.

This update to the Local Haze app also benefits Smoggie users and especially my volunteers around the world since it allows users to view and monitor the data from these devices.

Of course, the app supports many more data sources like PurpleAir, Luftdaten (with over 11,000 online devices), AirNow, US Department of State, uRADMonitors, and more to come.

iphone local haze
Local Haze v1.4, Smoggie Volunteer in Barcelona, Spain

Why is it important?

The easier and more comfortable we present data to the average people the more likely it is for them to embrace the technologies which are designed to increase awareness and to combat air pollution. People love their phones and they spend a great deal of time interacting with them, by porting air quality data to such devices, with the help of a free app, then it enables them to interact with their environment/communities.

Right now, while people all over the world are patiently waiting to go outdoors again, trying out Local Haze will show you the air quality outside your door. The covid-19 pandemic helped us see how air quality has improved significantly in cities all over the world and understand that urban air pollution is anthropogenic. It’s up to all of us to keep improving the way we live and the air we breathe.