Breathe Easy and Tinker Freely: A Review of the AIR-1 Air Quality Sensor for Home Assistant
For the privacy-conscious and perfectionist homeowners who crave customization, the AIR-1 Air Quality Sensor by Apollo Automation is a breath of fresh air (literally). This sensor goes beyond simply monitoring air quality; it empowers you to take control of your indoor environment.
A little background about Home Assistant: Home Assistant is an open-source home automation that puts local control and privacy first. Powered by a worldwide community of DIY enthusiasts. Think of it as Apple’s HomeKit with the ability for endless customizations.
Specifications
Particulate Sensor
CO2 Photoacoustic NDIR Sensor (Optional)
Gas Sensor MOS Package (CO, NO2, C2H5OH, H2, NH3, and CH4) (Optional)
TVOC Sensor
Temperature and Humidity Sensor
Barometric Pressure
3 RGB LEDs
USB-C
WiFi 2.4 GHz
Bluetooth 5
All the specifications and sensor manufactures are listed here.
Built for the DIY Enthusiast
Unlike many smart home devices, the AIR-1 doesn’t lock you into a proprietary ecosystem. It leverages the open-source power of Home Assistant, giving you complete control over your data and how it’s used. This is perfect for those who want to tinker and integrate the AIR-1 into their existing smart home setup.
Countless times I have mentioned that we need to monitor indoor and outdoor air quality. This is an essential step in order to have a holistic approach to air pollution that surrounds us in both environments. Unfortunately, not everybody can afford to buy two monitors but thanks to the community and AirGradient there are two DIY solutions that can help us monitor the air quality quite accurately and of course, manage the air we breathe better.
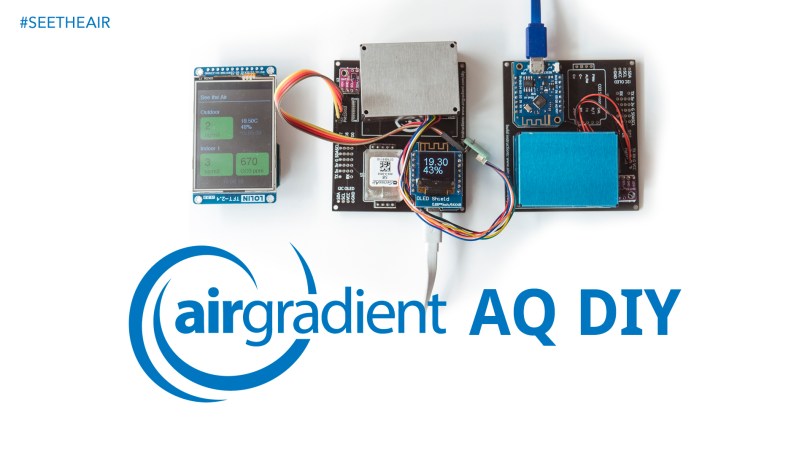
AirGradient’s DIY solution is more appealing than the competition for many reasons. First of all, you can buy directly the DIY Kit with all the electronic components from them including the PCB. The PCB is the board where we will deploy all the sensors, WiFi module, and display. That is a huge benefit because you don’t have to search on the internet and purchase the components one by one. The well-designed PCB will also help us keep the monitor neat and small without unnecessary cables. Secondly, Air Gradient’s DIY AQ Monitor is very customizable allowing us to build an indoor monitor with an NDIR CO2 sensor but another one without a CO2 sensor or display for the outdoor environment. If you don’t want temperature/humidity sensors you can easily omit them too, but I highly recommend them. Moreover, there is software support as a community of passionate people have been improving the firmware constantly. Finally, the solution comes with a web dashboard where you can manage all the monitors and take advantage of the histograms and tools like the alerts.
Additionally, the devices which are connected to the cloud and the dashboard can broadcast the measurements back to a separate display (Viewport) which allows us to see the air quality indoors and outdoors like in the example below. Isn’t that very cool?
It has been a long time since I soldered something, so I was very happy to build the monitor. I built two monitors by following the fairly easy instruction here. There is also a video with the instructions here by Jeff Geerling.
One day is left before the planet Earth, where 7.8 Billion people live, completes its orbit around the Sun. During our journey around the Sun and inside the universe we witnessed some good and bad moments for our planet and us.
We saw some terrible disasters like the Amazon rainforest wildfires, Bushfires in Australia, fires all over the world, which were very hard to control because of the extreme weather and climate change that rewards and favors such as extreme phenomenal to happen.
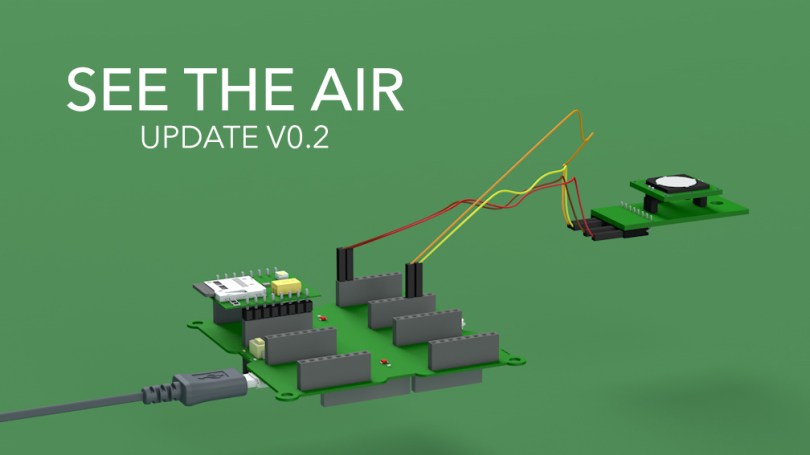
The Monitor it is getting more mature over the time. In this post I am presenting you the 3D case which you can download for free and print in a 3D printer of your choice.
I have designed the case on my own, and I have taken into account all the necessary parameters to make it practical and functional.
In my previous post I presented the version 0.1 of my DIY Air Quality Monitor which uses a Nitrogen Dioxide sensor. In this post I am going to analyse the Nitrogen Dioxide NO2 sensor which is made by Spec-Sensors DGS-NO2 968-043 .
Calibrating your sensor.
In most cases the sensor isn’t calibrated which means that we have to set a zero point in order to get more accurate measurements. The company can calibrate it for you in a special chamber but you have to pay extra. In order to calibrate it on your own you have to be in a clean environment – without the presence of NO2 or NO or O3 – and then follow the instructions below which I have taken from the datasheet.Read More »
Have you ever been in a situation where you wish you had had a device tailored to your needs? Over the years I have reviewed various Air Quality Monitors but each time they lack something which will make them unique to me. Don’t get me wrong each device has its features and characteristics, some of them are amazing and some of them not very useful. As a result, I decided to build my DIY AQM. I couldn’t have done it without Electronza and Teodor Costachioiu help with coding, he is a brilliant coder/engineer. I absolutely recommend you to check his blog you will find a lot of interesting projects.
A USA air quality monitor in comparison with a DIY German air quality monitor. How well do they perform with each other? Full disclosure, the software the monitors run is developed in the mentioned countries. The components from both devices are made mostly in China.
We already know PA-II’s correlation of coenficency R²≈0.87 with the corresponding FEM GRIMM and FEM BAM.
The SDS011 sensor which is most commonly used in the Luftdaten project has a correlation of coenficency R²≈0.84.
The PA-II features a double PMS5003 laser sensor. The PA-II module averages out the values from the two sensors, so in case one of the two sensors registers unexpected high readings, (perhaps some dust or insects etc) this technique makes the readings less questionable. The Luftdaten DIY project as we have mention above mostly uses one SDS011 laser sensor. However, the Luftdaten software supports many PM2.5 sensors including the PMS5003 series among others.
Analysis
My friend Ashley from Plume Plotter has already done a comparison between the Purple Air PA-II, the Luftdaten SDS011 and DEFRA for a complete year of data link.
First of all, by comparing PA-II’s two identical sensors we can see on the graph below that the Sensor B has the tendency to register higher concentrations over time, on my device, maybe another device has a different behavior. So the process of averaging out the concentrations from both sensors has some positive results.
Many scientific papers insist that the PMS5003 and SDS011 sensors are nephelometers and not particle counters. Which means that they are influenced by humidity. Nephelometer comes from the compound Greek word nephelo “Νέφος” which means cloud.
I live in an area with high humidity. Right now the official RH is 83%. The PA-II registers 51.6μg/m3 and Luftdaten 38.3μg/m3. The difference between them is huge. However, both devices are mistaken. Purely for your information the humidity sensor in the Luftdaten device measured RH 94% the PA-II measured RH 53% and AirVisual measured RH 72%. From my experience, I would say that the relative humidity is definitely above 80%.
From the graph below we can see the same results. The PM-II overestimates the PM2.5 concentrations most of the time in comparison with the Lufdaten sensor. Both devices seem to measure the same fluctuations over time so there is some correlation. The humidity that day started low at RH 30% and climbed up to 60% at the end of the day. There is an influence between humidity and how the sensors and especially the PA-II measure PM2.5 concentrations without any doubt.
SeeTheAir: 24h PA-II & Luftdaten side by side
Conclusion
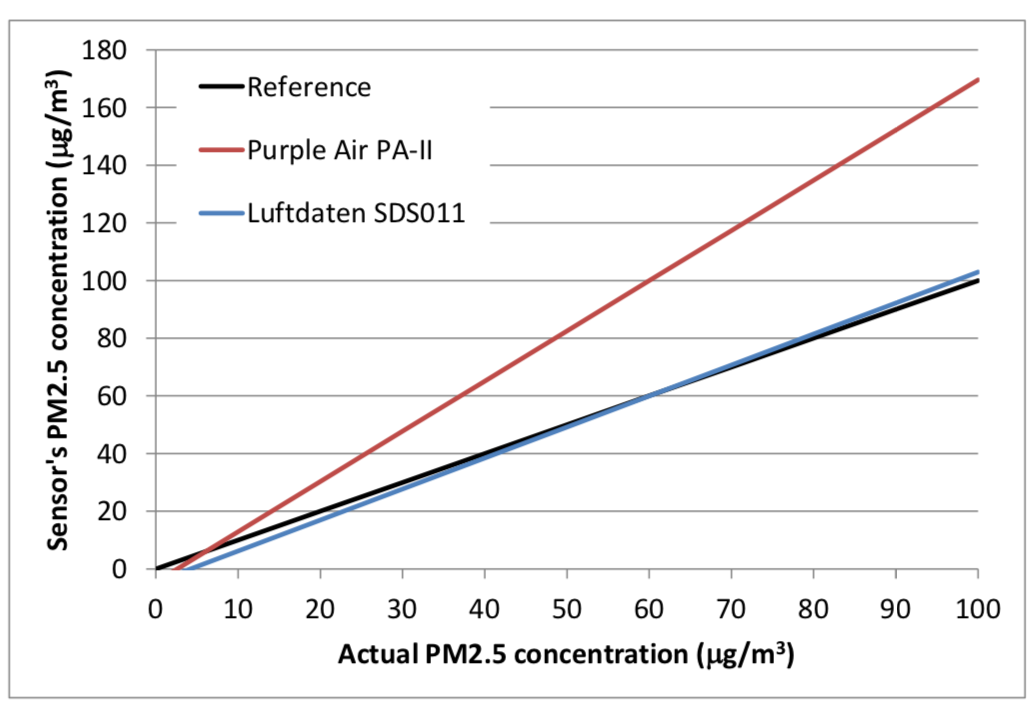
The conclusion that I get from my everyday readings having the two devices side by side and from Plume Plotter’s analysis is that the PA-II overestimates the PM2.5 concentrations especially when relative humidity is above ~55% while the Luftdaten’s readings are more adjacent to the official readings.
Plume Plotte: Regression lines for Luftdaten sensor and Purple Air PA-II sensor readings vs. actual (reference instrument) concentrations.
Do you think the current PM (Particulate Matter) monitors are too expansive or too risky to leave them outside? Do you need proofs for convincing your local authorities to take actions against air pollution?
Then it’s time to build your own personal outdoor PM DIY Monitor. It won’t cost you more than €32 and it can feed your community with valuable data about the air quality. Use that data to prove how bad is the air quality in your neighborhood or community.