CO2 Past Present Future

CO2 has increased the past years but do you know how much ppm of CO2 is there in our atmosphere now and how much ppm of CO2 was there in the past?

co2_data_mlo

One thing is for sure that it is climbing up and we are the blameworthy.

co2_trend_mlo

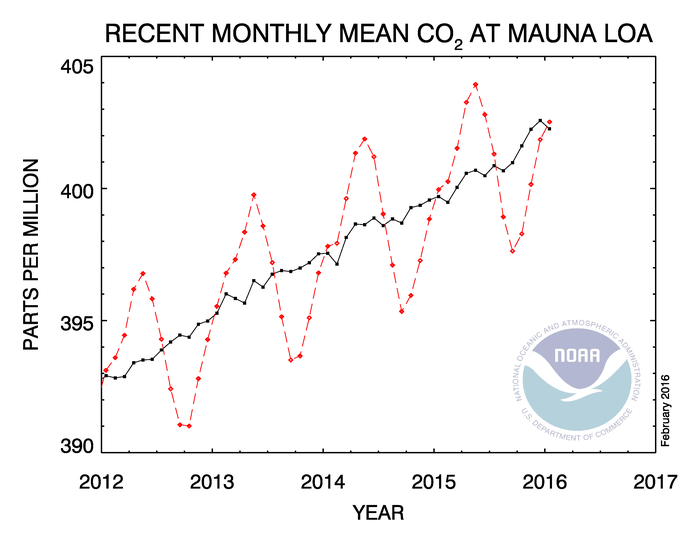
As you can guess the estimations for the CO2 in the future will be even higher and it is estimated that in 2100 it will reach a value of 800ppm (double than now).

December historical levels -averages

1958 – 314.67

1959 – 315.58

1960 – 316.19

1961 – 317.01

1962 – 317.69

1963 – 318.31

1964 – 318.71

1965 – 319.42

1966 – 321.08

1967 – 321.96

1968 – 322.84

1969 – 324.11

1970 – 325.13

1971 – 326.01

1972 – 327.55

1973 – 328.64

1974 – 329.5

1975 – 330.9

1976 – 331.65

1977 – 333.47

1978 – 334.83

1979 – 336.78

1980 – 338.29

1981 – 339.9

1982 – 340.88

1983 – 343.07

1984 – 344.55

1985 – 345.82

1986 – 347.15

1987 – 349.18

1988 – 351.44

1989 – 352.84

1990 – 354.27

1991 – 355.07

1992 – 355.53

1993 – 356.84

1994 – 358.87

1995 – 360.61

1996 – 362.18

1997 – 364.33

1998 – 367.08

1999 – 368.04

2000 – 369.67

2001 – 371.18

2002 – 373.71

2003 – 375.93

2004 – 377.45

2005 – 379.92

2006 – 381.79

2007 – 383.89

2008 – 385.56

2009 – 387.31

2010 – 389.73

2011 – 391.83

2012 – 394.28

2013 – 396.81

2014 – 398.85

2015 – 401.85

Table data source: Dr. Pieter Tans, NOAA/ESRL

When I was born in 1984 I was breathing 344ppm of CO2, now my body is breading 403ppm of CO2 (59ppm more). CO2 isn’t a direct threat for our health but it’s a direct threat for our planet and as a consequence an indirect threat to us.

Are we capable stopping the increase of CO2, What do you think?

Month of CO2 experiment

bedroomday0000 copy

So I am conducting a home experiment by observing the CO2 levels during night and my experiment focus on two fundamental questions.

  • Is the atmosphere inside the house getting worse during night?
  • Can specific plants help the air quality during night?

This experiment needs time, so you have to be patience till the experiment ends at the end of this month (February).

Stay tuned.

PM2.5 Device Comparison

There are so many devices available right now on the market that measure PM2.5 (as we can see on this post) but there aren’t all of them the same. In my opinion PM2.5 is the key for air quality monitoring. Different sensors, different manufacturers and also different software can give different results.

Let’s try to analyze them and see which of them are accurate and which ones aren’t. In order to do that firslty I will present some the sensor manufactures and models. Prices are in USD:

  • Novafitness SD011 ∼23$
  • Plantower PMS1003 ∼17$
  • Plantower PMS3003 ∼17$
  • Shinyei PPD42NS Made in Japan ∼10$ (R² ∼.83)
  • Shinyei PPD60PV (More expensive than the PPD42 because it allows smaller particle detection) Used by AirBeam
  • Samyoung DSM501 Korean copy of the Shinyei PPD42 ∼5$ Used by Speck
  • Sharp GP2Y10 ∼15$ (Used by Awair and probably by Foobot) (R² ∼.74)
  • TZOA RD02  135$-600$ Used by TZOA Wearable (R² .9253)
  • Dylos DC1100 ∼300$ (R² ∼.85)
  • DustTrak TSI DRX 8533 ∼3000$ (R² ∼.97)
  • Turnkey Instruments Dustmate ∼3200$

Here we can see some graphs of different sensors cheap ones and expensive ones. In general the expensive ones are more accuarte and industrial graded but some new companies have managed to build low cost sensors with high accuracy.


Screen Shot 2016-01-29 at 22.49.01
aqicn.org/sensor
Screen Shot 2016-01-30 at 19.12.23.png
Shinyei R-squared .83 correlation value
Screen Shot 2016-01-30 at 19.12.59
Sharp R-squared .74 correlation value
gm4z989eevgqiw7g3uy7
TZOA R-squared .9253 correlation value


On the table below there are some of the devices that measure PM2.5 among other stuff and have been reviewed by the Air Quality Sensor Performace Evaluation Center aka AQ-SPEC www.aqmd.gov. Focus on the R² (correlation) values on the last column “Sensors vs FRM/FEM Method”.

An R2 of 1 indicates that the regression line perfectly fits the data, while an R2 of 0 indicates that the line does not fit the data at all. So, closer to 1 then better results.

summarytable


References:

http://aqicn.org/sensor

http://www.aqmd.gov/aq-spec/evaluations#&MainContent_C001_Col00=2

http://www.davidholstius.com

http://www.howmuchsnow.com/arduino/airquality/

Low cost air pollution sensors: New perspectives for the measurement of individual exposure? Madelin Malika, Duché Sarah

https://www.indiegogo.com/projects/tzoa-wearable-air-quality-tracker#/