
A reader of the blog took the initiative to establish a contact between PurpleAir and me, as a result the PurpleAir II outdoor Particulate Matter monitor is here for a review. Thank you Daniel.
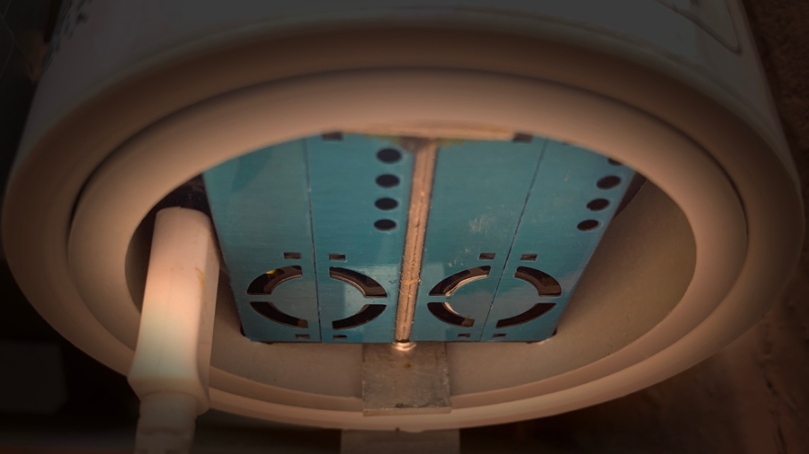
The monitor is very compact and it can be easily distinguished from the rest because it has 2 Particulate Matter sensors. Both of them work together to establish better results and a coefficient of determination (R²).
Hardware
- Microcontroller ESP8266
- Built in WiFi for logging to “The Cloud” WiFi 802.11 b/g/n 2.4 GHz | WPA/WPA2
- 2 PMS5003 laser counters
- BME280 Temperature, Humidity and Pressure sensor
- Micro USB Power Supply
- *Optional SD Card Slot and Real Time Clock
The estimated total mass for PM1.0, PM2.5 and PM10 is averaged by the PurpleAir Internet of Things (IoT) control board. Readings are then uploaded to the cloud every 80 seconds or so where they are stored for download and display on the PurpleAir map.
A field evaluation has been conducted by the SCAQMD in which two Federal Equivalent Method were used (BAM & GRIMM) and they found the following results (full evaluation):
- PM1.0 sensor data correlated very well (R²> 0.96) with the corresponding values collected using a substantially more expensive particle instrument (GRIMM) and were quite accurate.
- PM2.5 sensor data correlated very well with the corresponding FEM GRIMM and FEM BAM values (R² > 0.93 and R² > 0.86) and were quite accurate.
- PM10 sensor measurements correlated well with the corresponding GRIMM and FEM BAM values (R² >0.68 and R² > 0.60) (1-hr average).
On a different technical evaluation, which was done by the San Joaquin Valley Air Pollution Control District, they found a correlation of R² ∼ 0.83 on a 24-hour average comparison (full evaluation).
These results are very good, a closer value to R²=1 means that the device is as good as a US$25,000 instrument (MetOne BAM FEM).
The BME280 is a small SMD sensor made by Bosch which can measure Temperature, Humidity and Pressure. The sensor is reporting conditions inside the sensor housing, not ambient conditions. As a result readings are affected by the electronics so temperature may be elevated and humidity under estimated.
Software
The ESP8266 has a limited internal memory typically of 4MB and the software of the device becomes very limited too, at least locally. This is the reason the device doesn’t offer a lot of configuration options rather than the Wi-Fi and there isn’t an option to change the Temperature from ºF Fahrenheit to ºC Celsius yet.
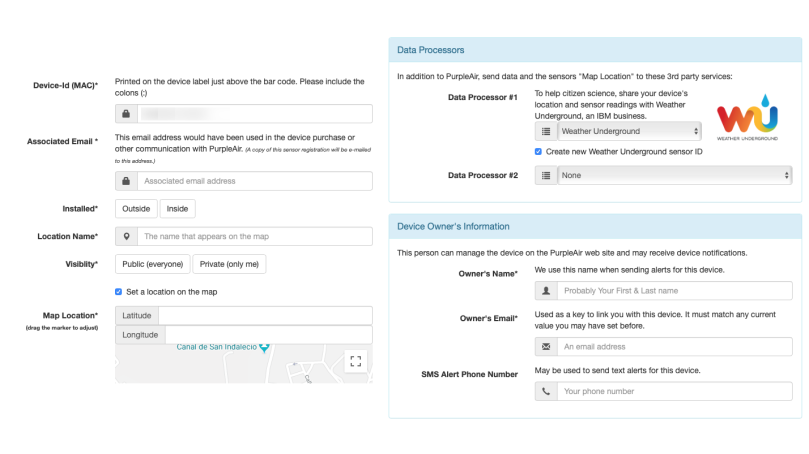
When you register the device for the first time there are a lot of options to consider, like if you want the data to stay private or public (please, allow others to see the air quality in your area), the location of the device, Data Processors such as the Weather Underground or your own server and some contact info.
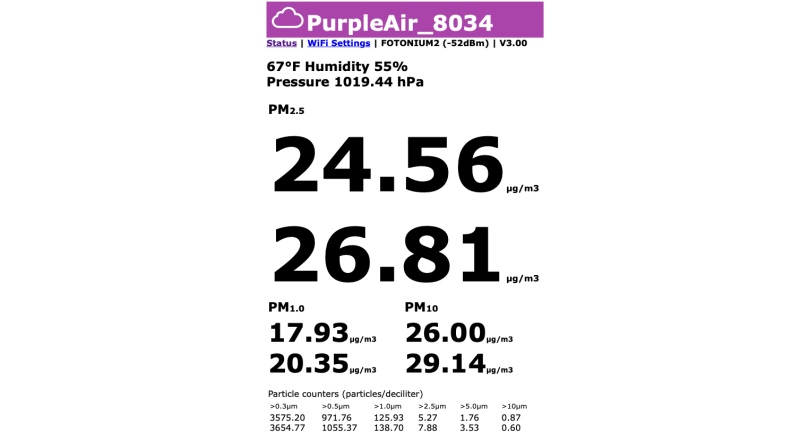
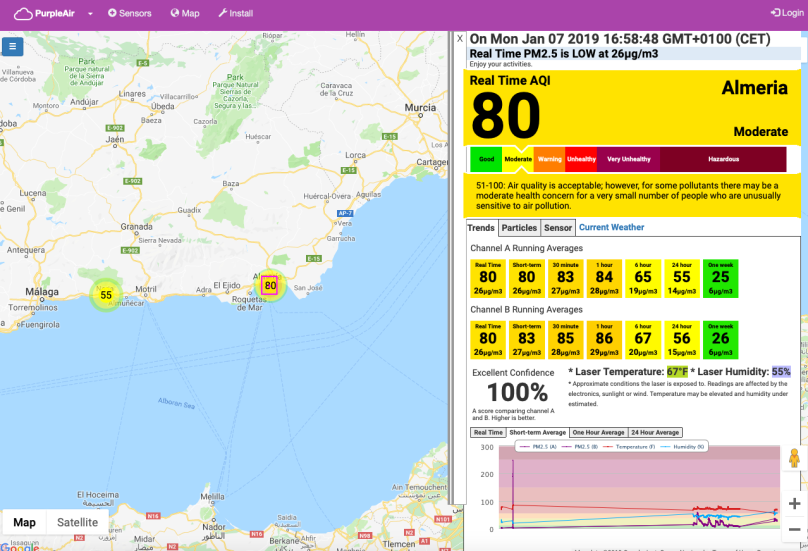
The end-user has two ways to access the data. One way is to access the real-time data through a soft-AP IP address the router creates when the device connects to it and another way to access the data is through the online portal map at https://www.purpleair.com
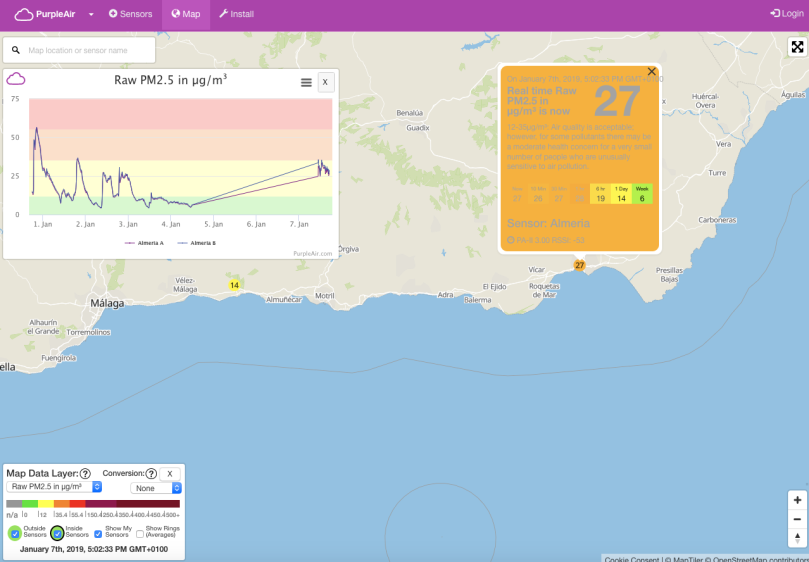
The web site will provide a different version of the Map to the users depending the web browser you are using. For example, on Safari we can see on the left the map and on the right of the screen the Real-Time AQI, Trends, Temperature/Humidity, a lot of tabs to choose between and even a graph which compares the sensor A and B. Safari doesn’t support well WebGL API and the company has been forced to develop a different version of the map.
On the other hand on Firefox and Chrome the information is presented in more clean way and there is an option to download a PNG/JPG/PDF/SVG file of the graph something that it isn’t possible on Safari. However, you can’t see real-time Temperature and Humidity and PM2.5… values all together unless you choose different Map Data Layer each time. It supports the US EPA AQI standards and Canadian AQHI standards and raw PM1, PM2.5 and PM10 data in μg/m³ with conversions to AQandU and LRAPA. The conversions help accommodate different types of pollution with different particle densities and for specific airsheds. (An airshed is a part of the atmosphere that behaves in a coherent way with respect to the dispersion of emissions.)
Finally, users can download the measurements from their sensor and from other sensors as well in a .csv file format at https://www.purpleair.com/sensorlist
- Find and mark the sensor/s in the list you want to download – use CTRL + F to quickly search by sensor name.
- Return to the top of the page and enter the desired date range, then click Download Selected

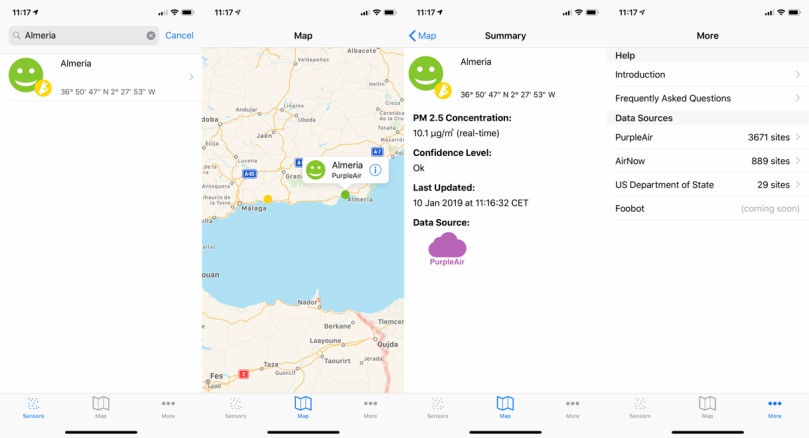
Although PurpleAir currently does not have an app, there is a free iOS app called Local Haze which supports PurpleAir’s monitors. The app detects the nearest sensor to you and displays some basic data for the PM2.5 concentration in real-time.
Conclusion
I highly recommend you to use Firefox/Chrome as the browser of your choice to take full advantage of the PurpleAir’s website. I like the soft access point (soft-AP) which the device creates on the local Wi-Fi network, it is clean and very easy to understand, but it misses the visualization of the temperature in ºC Celsius simply because a lot of people understand temperature in Celsius and so do I (Keep in mind the temp/humidity data are not useful). The online portal offers a lot of data but a more simple and uncomplicated way to display and download data is needed. However, I can say with certainty that there is a scientific team behind the PurpleAir monitor which works hard to deliver a great product. The ability to download a .csv file with the measurements your device has taken is awesome. So, software-wise the device needs some work because it needs to be more approachable. Hardware-wise the device offers a concrete solution for those who want reliability thanks to the dual particulate matter sensors.
The device can be purchased online at https://www.purpleair.com/
Stay tuned because in the next article I will compare the PurpleAir II with the DIY Luftdaten PM2.5 sensor.
Discover more from See The Air
Subscribe to get the latest posts sent to your email.

any idea of the pricerange?
LikeLiked by 1 person
It’s on the website http://www.purpleair.com/sensors
US$179 for 1-2 units
LikeLike
179 is for the PurpleAir I
229 for the PurpleAir II
LikeLike
The JSON APIs on both the cloud and local interfaces make interfacing with home automation pretty simple as well. My main reason for getting it was to shutdown ventilation fans when my neighbors burn brush piles and show them just how bad those burns make the air in our valley. Info on how I did it can be found here https://automation.rmrr42.com/2019/01/monitoring-air-quality-with-purple-air.html
LikeLiked by 1 person
This is an awesome idea. Thanks for sharing
LikeLike
[…] Haze. It is similar to the Breathe app but this one combines data from many sources like Luftdaten, PurpleAir, AirNow, US Department State and more sources are coming. It eliminates the need to check the AQI […]
LikeLike
[…] already know PA-II’s correlation of coenficency R²≈0.87 with the corresponding FEM GRIMM and FEM […]
LikeLike
I use a PA-II SD model in a standalone, offline mode. The data in the daiy.csv files are used later for analysis. One problem is the inbuild RTC (clock), as it has a strong drift (at least 1 hour/month). Is it possible to set/reset) this clock by logging into the ESP8266 with a terminal or SSH? (i.e. does the USB connector behave as a serial device?)
LikeLiked by 1 person
Mine doesn’t have an RTC so I don’t know for sure. However, the USB can be used to program the device, and maybe the serial monitor can send commands to the device.
LikeLike
[…] Review: PurpleAir II […]
LikeLike
One problem I see with the device is that it maintains the original WiFi server you use to connect to register the device. That WiFi is unprotected, so my anybody within the range of the sensor can connect to and do potentially nefarious things. I isolated the device on its own WiFi and VLAN network, with no access to my internal network. It still bothers me that one cannot disable the WiFi completely and be able to access it through purpleair.com.
LikeLiked by 1 person
[…] information from many sources including the Sensor Community with over 12,000 sensors, PupleAir, and uRad Smoggies. Also, it is available globally. You can choose your favorite monitor, and […]
LikeLike
[…] Review: PurpleAir II […]
LikeLike
[…] Source: https://seetheair.org/2019/01/15/review-purpleair-ii/ […]
LikeLike